Beschreibung
TeoriaCutrim ist ein statistischer Overlay-Indikator, der entwickelt wurde, um das jüngste Marktverhalten durch Kerzenverteilung und Volatilitätsanalyse zu quantifizieren. Anstatt die Richtung vorherzusagen, liefert er objektive Daten darüber, was der Markt innerhalb eines konfigurierbaren Kerzenfensters gerade getan hat.
Analysierte Marktdaten
Der Indikator wertet eine vom Benutzer definierte Anzahl jüngster Kerzen (Lookback-Periode) aus und extrahiert:
- Anzahl und Prozentsatz der bullischen Kerzen (Schluss > Eröffnung)
- Anzahl und Prozentsatz der bärischen Kerzen (Schluss < Eröffnung)
- Differenz zwischen bullischer und bärischer Dominanz
- Durchschnittliche Kerzengröße (in Pips)
- Aktuelle Kerzengröße (in Pips)
- Gesamte Preisspanne im analysierten Fenster
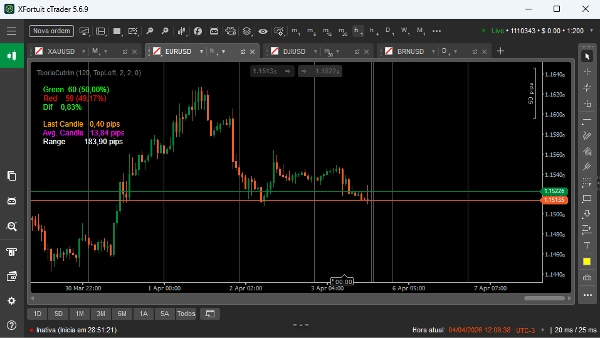
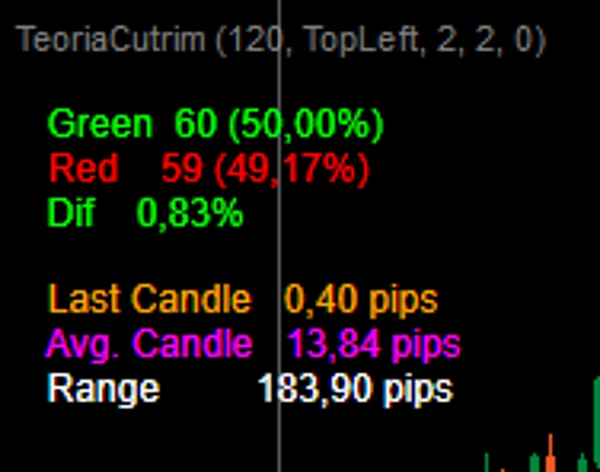
Visuelle Ausgabe und Interpretation
Der Indikator zeigt wichtige Kennzahlen direkt im Chart an:
- Grün: Gesamtzahl der bullischen Kerzen und Prozentsatz
- Rot: Gesamtzahl der bärischen Kerzen und Prozentsatz
- Dif: absolute Differenz zwischen bullischen und bärischen Prozentsätzen
- Letzte Kerze: aktuelle Kerzengröße in Pips
- Durchschn. Kerze: durchschnittliche Größe der Kerzen im ausgewählten Fenster
- Spanne: Abstand zwischen dem höchsten Hoch und dem niedrigsten Tief im Fenster
Die Interpretation ist einfach:
- Eine höhere Anzahl bullischer Kerzen deutet auf jüngsten Aufwärtsdruck hin
- Eine höhere Anzahl bärischer Kerzen deutet auf jüngsten Abwärtsdruck hin
- Eine geringe Differenz (Dif) zeigt Gleichgewicht oder Zufälligkeit an
- Eine zunehmende durchschnittliche Kerzengröße weist auf eine steigende Volatilität hin
- Eine große Gesamtsumme der Spanne deutet auf Marktausdehnung hin, während eine kleine Spanne auf Kompression hindeutet
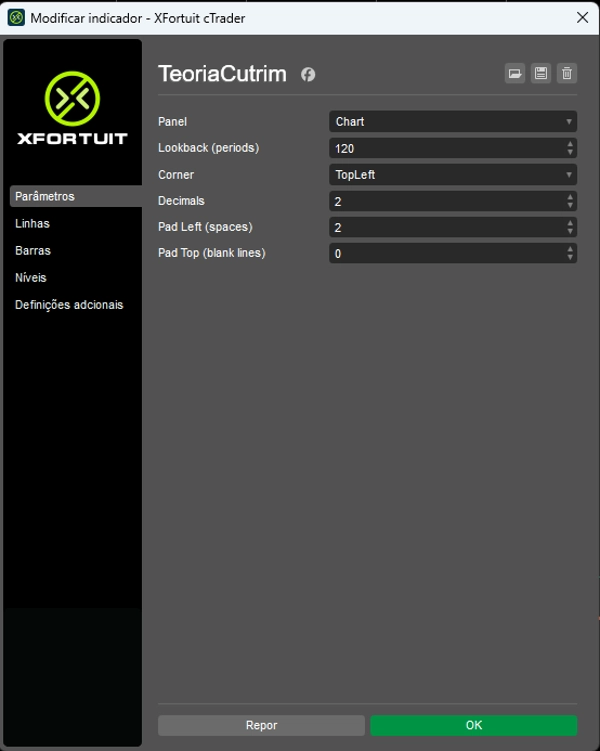
Wichtige Parameter
- Lookback: Anzahl der für die Analyse verwendeten Kerzen (vollständig anpassbar)
- Ecke: Bildschirmposition der Datenanzeige
- Dezimalstellen: Anzahl der angezeigten Dezimalstellen
- Abstand links / Abstand oben: visuelle Abstandsanpassungen
Anwendungsfälle
TeoriaCutrim wird am besten als Kontextwerkzeug verwendet, nicht als Signalgenerator. Typische Anwendungen umfassen:
- Messung statistischer Ungleichgewichte vor dem Einstieg in Trades
- Erkennung von Volatilitätserweiterung oder -kontraktion
- Filterung von Trades basierend auf dem Verhalten der jüngsten Kerzen
- Unterstützung quantitativer oder wahrscheinlichkeitstheoretischer Strategien
Zielgruppe
Dieser Indikator ist für Trader konzipiert, die sich auf Daten, Statistiken und objektive Analysen verlassen, statt auf subjektive Mustererkennung. Geeignet für sowohl diskretionäre als auch systematische Trader.