Penerangan
TrendFallowing: adalah penunjuk teknikal lanjutan untuk platform cTrader yang menggabungkan pelbagai pendekatan analitik ke dalam satu penyelesaian. Dibangunkan untuk pedagang yang mencari pengesahan trend melalui konvergensi penunjuk, ia menawarkan pandangan pasaran yang lengkap dengan isyarat tepat dan penapis pengesahan.
TONTON VIDEO PENGENALAN MENGENAI STRATEGI OPERASI!
🎯 STRATEGI PENGGUNAAN
1. Perdagangan Mengikuti Trend
Aplikasi: Kenal pasti dan ikuti trend yang telah ditetapkan
Jangka masa: H4, D1 untuk posisi yang lebih panjang
Tetapan: ADX > 25, Volum di atas purata
Pengurusan Risiko: Stop-loss di bawah purata bergerak 50 tempoh
2. Perdagangan Swing
Aplikasi: Tangkap pergerakan jangka sederhana
Jangka masa: H1, H4
Tetapan: Penapis volum diaktifkan, pengesahan oleh Profil Volum
Sasaran: Profil Volum POC sebagai TP
3. Perdagangan Breakout
Aplikasi: Masuk pada breakout sokongan/rintangan
Tetapan: Volum PVA untuk mengesahkan kekuatan pergerakan
Pengesahan: ADX meningkat + Volum di atas purata
4. Scalping (Jangka Masa Lebih Pendek)
Aplikasi: Perdagangan cepat dengan pelbagai pengesahan
Jangka masa: M1, M5
Tetapan: Penapis volum ketat dan Momentum
🔧 BAGAIMANA PENUNJUK BERFUNGSI
TERAS ADX & DI
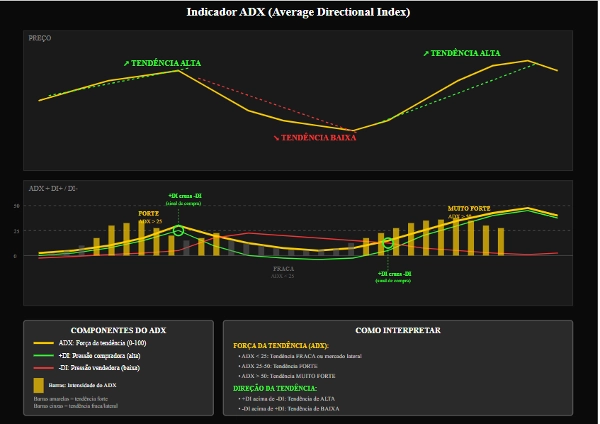
ADX (Indeks Arah Purata)
Fungsi: Mengukur kekuatan trend
Tafsiran:
0-25: Trend lemah/pergerakan mendatar
25-50: Trend kuat
50+: Trend sangat kuat
Penggunaan Praktikal: Elakkan perdagangan apabila ADX < 20
+DI / -DI (Penunjuk Arah)
+DI: Kekuatan pembeli
-DI: Kekuatan penjual
Isyarat: Persilangan +DI melebihi -DI (beli) dan sebaliknya
Cerun ADX (Cerun ADX)
Fungsi: Mengukur pecutan trend
Plot: Histogram cyan
Isyarat: Nilai positif menunjukkan trend yang menguat
PENAPIS VOLUM
Penapis MA Volum
Fungsi: Mengesahkan isyarat dengan volum di atas purata
Parameter: Tempoh 20, Pengganda 1.0
Penggunaan: Pengesahan minat institusi
Volum PVA (Analisis Harga Volum)
Warna dan Makna:
Hijau: Beli dengan volum sangat tinggi (>150% purata)
Biru: Beli dengan volum tinggi
Merah: Jual dengan volum sangat tinggi
Merah Jambu: Jual dengan volum tinggi
Kuning: Bar Pin/Kepenatan dengan pecahan sokongan
PROFIL VOLUM
POC (Titik Kawalan)
Fungsi: Harga dengan volum dagangan tertinggi
Penggunaan: Sasaran semula jadi untuk perdagangan, sokongan/rintangan dinamik
Kawasan Nilai
Fungsi: Zon di mana 70% volum didagangkan
Tafsiran:
Harga di atas: Trend menaik
Harga di bawah: Trend menurun
Di dalam: Pergerakan mendatar mungkin
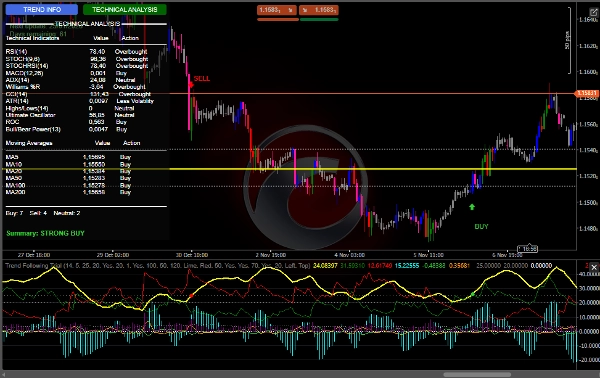
Panel Penunjuk
RSI: Jualan berlebihan (<30) / Beli berlebihan (>70)
MACD: Momentum
Williams %R: Keadaan Ekstrem
CCI: Pengenalpastian Pembalikan
Stochastic: Momentum jangka pendek
Ultimate Oscillator: Momentum pelbagai jangka masa
Purata Bergerak
Set lengkap MA (5, 10, 20, 50, 100, 200)
Analisis penjajaran untuk trend
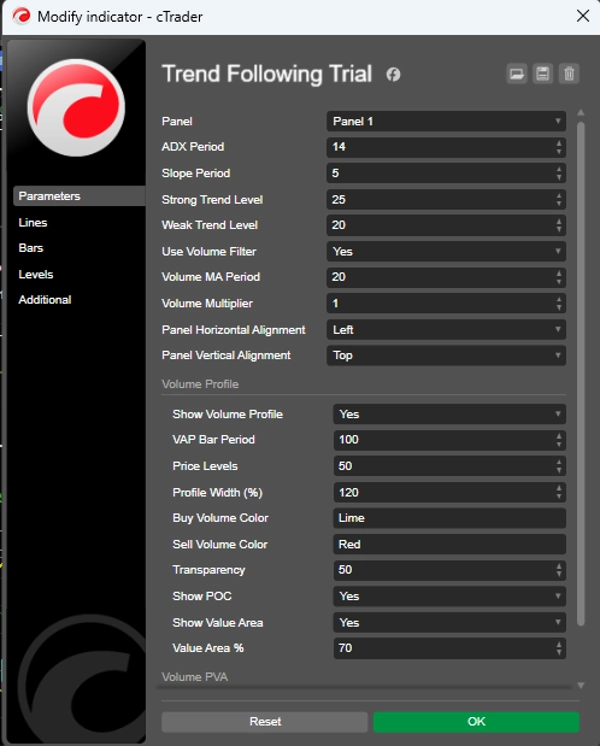
⚙️ TETAPAN YANG DISYORKAN
Tetapan Konservatif
Tempoh ADX: 14
Tempoh Cerun: 5
Tahap Trend Kuat: 25
Tahap Trend Lemah: 20
Gunakan Penapis Volum: benar
Tempoh MA Volum: 20
Pengganda Volum: 1.2
Tetapan Agresif
Tempoh ADX: 10
Tempoh Cerun: 3
Tahap Trend Kuat: 20
Tahap Trend Lemah: 15
Gunakan Penapis Volum: benar
Tempoh MA Volum: 14
Pengganda Volum: 1.0
Profil Volum (Disyorkan)
Tunjukkan Profil Volum: benar
Tempoh Bar VAP: 100
Tahap Harga: 50
Peratusan Kawasan Nilai: 70
Tunjukkan POC: benar
🎨 SUMBER VISUAL
Antara Muka Pengguna
Panel Dinamik: Maklumat masa nyata
Butang Interaktif: Tukar antara analisis
Warna Intuitif: Pengekodan berasaskan fungsi
Isyarat Grafik
Anak Panah: Masuk BELI/JUAL
Bunyi: Amaran boleh didengar
Warna Bar: Analisis PVA terintegrasi