
Beschreibung
Amplitude Momentum Label — Adaptive Trend Detection Powered by Volatility
Der Amplitude Momentum Labeler vereint mehrere fortschrittliche Konzepte:
- Regime-Erkennung — Identifiziert echte Trendphasen
- Volatilitätsanpassung — Passt sich selbst an die aktuellen Marktbedingungen an
- Dynamischer VWAP — Hebt bedeutende Rückzugs- und Fortsetzungsniveaus hervor
- Roll Spread Schätzer — Signalisiert optimale Wiedereinstiegspunkte während Trends
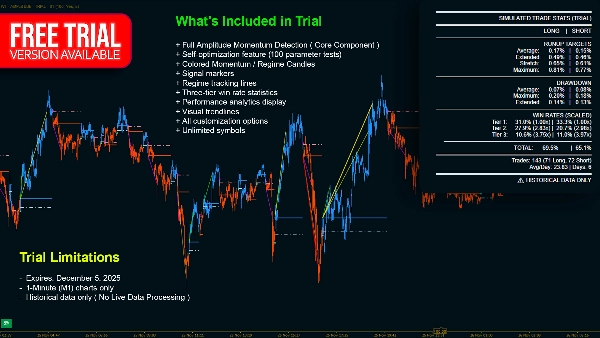
- OPTIMIERUNGSMODUL — mit Selbstoptimierungsfunktion**
Dies schafft einen intelligenten, sich selbst anpassenden Indikator, der Klarheit, Anpassungsfähigkeit und umsetzbare Handelszonen liefert – ohne ständiges manuelles Nachjustieren.
Was ist das?
Der Amplitude Momentum Labeler ist ein Regime-Erkennungsindikator, der in Echtzeit erkennt, wann der Markt in Aufwärts- oder Abwärtsmomentumphasen eintritt oder diese verlässt—in Echtzeit.
Im Gegensatz zu traditionellen gleitenden Durchschnitts-Crossovers misst er tatsächliche Momentumverschiebungen, indem er Preisverschiebungen und Umkehrstärke bewertet.
Die Kernfrage
Befindet sich der Markt derzeit in einer Momentumphase – und in welche Richtung?
Um dies zu beantworten, verfolgt der Indikator:
- Amplitude — wie weit sich der Preis bewegt hat;
- Sequenz — die Reihenfolge, in der Hochs und Tiefs auftreten.
Eine starke Bewegung, gefolgt von einer bedeutenden Umkehr, markiert den Beginn eines neuen Momentum-Regimes.
Wie es funktioniert
1. Messen des Schwungs
Der Indikator aktualisiert ständig die höchsten und niedrigsten Preisextreme.
Ihre Differenz—Amplitude—definiert die aktuelle Schwunggröße des Marktes.
2. Umkehr erkennen
- Ein starker Rückgang, gefolgt von einer kräftigen Rally → **Aufwärtsmomentum**
- Ein starker Anstieg, gefolgt von einem kräftigen Rückgang → **Abwärtsmomentum**
3. Bedeutung bestätigen
Nur Umkehrungen, die einen volatilitätsangepassten Schwellenwert überschreiten, lösen ein gültiges Signal aus.
4. Erschöpfung erkennen
Wenn der Preis nicht mehr voranschreitet, erkennt der Indikator eine Momentum-Erschöpfung und kehrt in den Neutralzustand zurück.
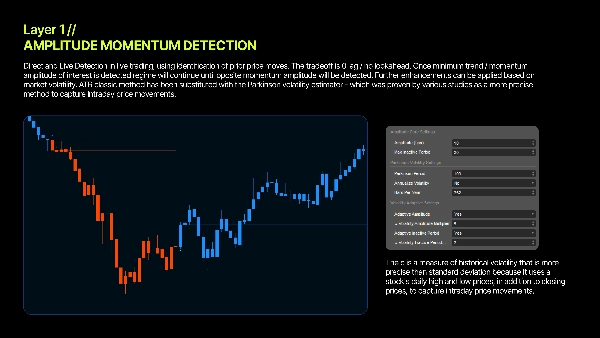
Parkinson Volatilität — Adaptive Schwellenwerte
Die meisten Indikatoren verwenden feste Parameter. Dieser passt sich automatisch an. Durch die Verwendung von Parkinson Volatilität— die intraday Hoch-/Tief-Bereiche einbezieht — passt der Indikator die Empfindlichkeit basierend auf den tatsächlichen Marktbedingungen an. Das Ergebnis: konsistente Leistung in ruhigen und volatilen Umgebungen. (Statistisch nachweislich effizienter als die ATR-Methode)
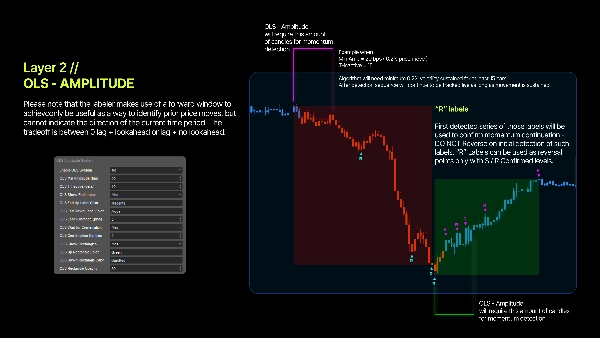
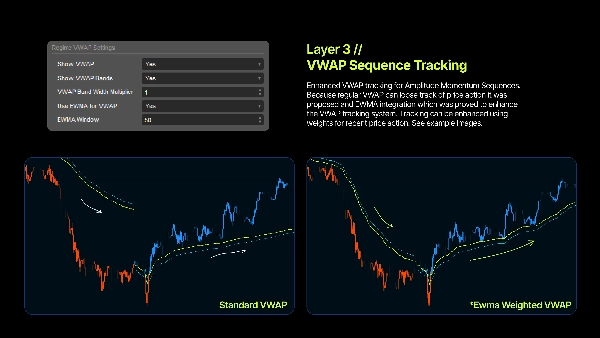
Regime VWAP — Dynamische Niveaus für Wiedereinstieg
Sobald ein Regime aktiv ist, berechnet der Indikator einen auf diesen Trend spezifischen VWAP, der dynamische Unterstützungs- und Widerstandsniveaus bietet. Institutionen verlassen sich stark auf den VWAP, und der Preis reagiert oft in dessen Nähe – was ihn ideal für Pullback-Einstiege macht.
EWMA-Modus
Aktivieren Sie EWMA, um neueren Preisen ein höheres Gewicht zu geben und eine glattere, reaktionsschnellere VWAP-Kurve zu erzeugen. Hervorragend geeignet, um Wiedereinstiege während ausgedehnter Trends zu identifizieren.
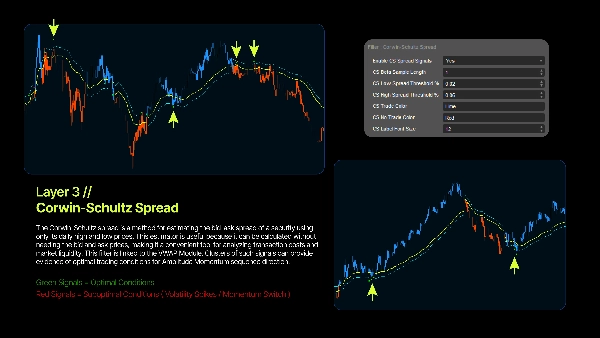
Roll Spread Schätzer - Dynamischer Filter für Wiedereinstieg
Ein Roll Spread Schätzer ist eine Methode zur Schätzung des Bid-Ask-Spreads anhand beobachteter Handelspreise, typischerweise unter Verwendung der seriellen Kovarianz von Preisänderungen. Entwickelt von Roll, geht sie davon aus, dass aufeinanderfolgende Trades zwischen Bid- und Ask-Preisen wechseln und neue Informationen den "wahren" Preis nicht ständig verändern. Obwohl einfach und grundlegend, wurde die ursprüngliche Methode verfeinert, um Probleme wie Abwärtsverzerrung und schlechte Leistung in bestimmten Datensätzen zu beheben. Der Schätzer basiert auf der Idee, dass Preise ohne neue Informationen einfach zwischen Bid und Ask schwanken. Es wird eine gleiche Wahrscheinlichkeit für einen kaufinitiierenden und einen verkaufsinitiierenden Trade angenommen.
Nutzungsvorteile
1. Objektive Trendidentifikation - Keine Trendlinien. Kein Rätselraten. Die Mathematik definiert das Regime.
2. Volatilitätsadaptiv - Passt sich automatisch an wechselnde Bedingungen mit Parkinson Volatilität an.
3. Klare Einstiegszonen - Regime VWAP-Niveaus helfen, intuitive Pullback- und Zusatzbereiche zu identifizieren.
4. Definierte Regimegrenzen - Wissen Sie genau, wann Momentum beginnt und wann es endet.
5. Multi-Timeframe-Kompatibilität - Basispunkt-Normalisierung sorgt für konsistentes Verhalten in jedem Chart.
Die quantitative Grundlage
Logarithmische Renditen
Die Verwendung von logarithmischen Renditen gewährleistet Symmetrie und macht die Messung des Momentums mathematisch robust.
Basispunkte
Alle Berechnungen verwenden standardisierte bps-Einheiten (1 bps = 0,01 %), was eine konsistente Anwendung über verschiedene Assets hinweg ermöglicht.
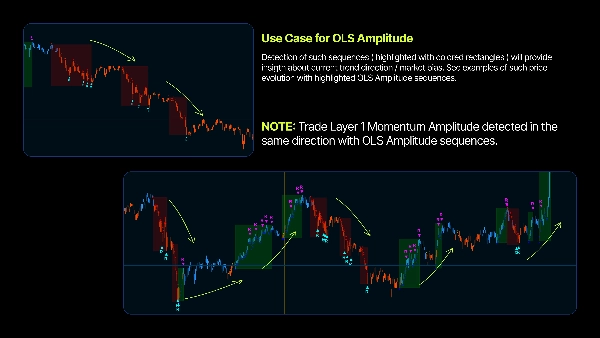
Retracement-Erkennung
Momentumverschiebungen werden durch starke Richtungsbewegungen gefolgt von bedeutenden Gegenbewegungen (V-förmige Umkehrungen) identifiziert.
Synthetisches Volumen
Bereichs- und kerzenkörperbasiertes synthetisches Volumen gewährleistet die Genauigkeit des VWAP für jedes Symbol.
⎽⎽⎽⎽⎽⎽⎽⎽⎽⎽⎽⎽⎽⎽⎽⎽⎽⎽⎽⎽⎽⎽⎽⎽⎽⎽⎽⎽⎽⎽⎽⎽⎽⎽⎽⎽⎽⎽⎽⎽⎽⎽⎽⎽⎽⎽⎽⎽⎽⎽⎽⎽⎽⎽⎽⎽⎽⎽⎽⎽⎽⎽⎽⎽⎽⎽⎽⎽⎽⎽⎽⎽⎽⎽⎽⎽⎽⎽⎽⎽⎽⎽⎽⎽⎽⎽⎽⎽⎽⎽⎽⎽⎽⎽⎽⎽⎽⎽⎽⎽⎽⎽⎽⎽⎽⎽⎽⎽⎽⎽⎽
Dieses Tool dient nur zu Bildungs- und Informationszwecken. Es stellt keine Anlageberatung dar. Der Handel ist mit Risiken verbunden, und Verluste können Einlagen übersteigen. Vergangene Leistungen garantieren keine zukünftigen Ergebnisse. Sie sind allein verantwortlich für alle Handelsentscheidungen. Der Ersteller haftet nicht für finanzielle Verluste, die durch die Nutzung des Indikators entstehen. Führen Sie stets Ihre eigene Analyse vor dem Handel durch.
Zusammenfassung
Key features include:
- **Regime Detection:** Pinpoints market entry and exit points for momentum trends.
- **Volatility Adaptation:** Uses Parkinson Volatility to self-tune sensitivity based on current market conditions, ensuring consistent performance across varying volatility.
- **Dynamic VWAP:** Calculates a volume-weighted average price specific to each trend regime, providing dynamic support and resistance levels for pullback and continuation entries.
- **Roll Spread Estimator:** Estimates bid-ask spreads to signal optimal re-entry points during trends.
- **Self-Optimization Module:** Automatically adjusts parameters without manual intervention.
The indicator operates by continuously tracking price extremes to measure swing amplitude, detecting significant reversals that exceed volatility-adjusted thresholds, and identifying momentum exhaustion when price progression stalls. It uses logarithmic returns and basis-point normalization for mathematically robust, cross-asset consistency. Synthetic volume calculations enhance VWAP accuracy across symbols.
This tool supports multiple markets including Forex, stocks, indices, commodities, and cryptocurrencies, and is compatible with various timeframes. It outputs visual signals and filters to assist traders in objective trend identification and clear entry zone determination.
Kundenbewertungen
5 | 75 % | |
4 | 25 % | |
3 | 0 % | |
2 | 0 % | |
1 | 0 % |


