
Inside Candle
مؤشر
1 عمليات الشراء
الإصدار 1.0، Oct 2025
Windows, Mac
5.0
التقييمات: 2
الوصف
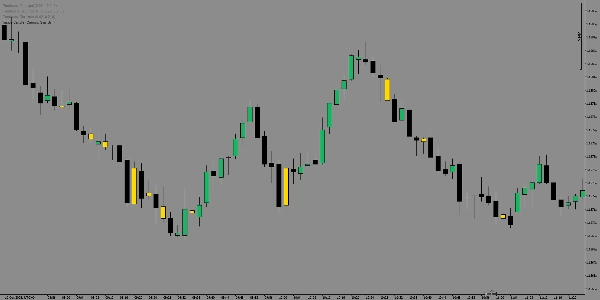
حدد مناطق الاختراق القوية وتوحيد السوق بدقة باستخدام مؤشر الشمعة الداخلية.
تسلط هذه الأداة الضوء على كل نمط الشمعة الداخلية — اللحظات التي ينكمش فيها التقلب ويستعد السوق لحركة انفجارية.
من خلال الكشف عن متى يكون أعلى وأدنى الشمعة محتوى بالكامل داخل الشمعة السابقة، فإنها تميز بصريًا مناطق التراكم أو التردد، مما يساعدك على توقع نقاط الاختراق المحتملة قبل حدوثها.
استخدمها لـ:
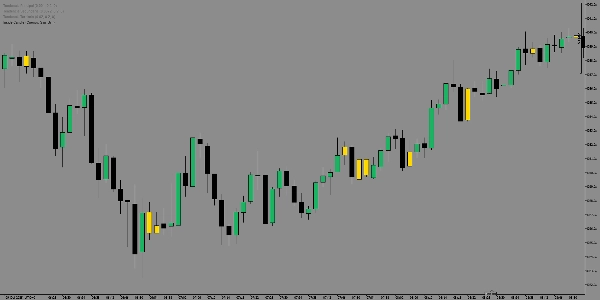
- اكتشاف إعدادات استمرار الاتجاه و الانعكاسات المبكرة.
- تصفية الصفقات حسب مناطق ضغط التقلب.
- التعرف فورًا على متى يكون السوق "يشحن الطاقة" للحركة التالية.
نظيف، دقيق، وبصريًا بديهي — مؤشر الشمعة الداخلية يحول هيكل السوق المعقد إلى رؤى بصرية بسيطة.
الملخص
ملخص الذكاء الاصطناعي
The Inside Candle indicator identifies Inside Bar patterns by detecting when a candle’s high and low are fully contained within the previous candle. This highlights zones of market consolidation and volatility contraction, signaling potential breakout points. It visually marks areas of accumulation or indecision, helping traders anticipate trend continuations or early reversals. The indicator supports markets including Forex, commodities, indices, and symbols such as EURUSD, GBPUSD, USDJPY, BTCUSD, XAUUSD, and NAS100. Key features include filtering trades by volatility compression zones and providing clear, intuitive visual cues to recognize when the market is preparing for significant moves. This tool is designed to simplify complex market structures into actionable insights for breakout and trend-following strategies.
ملف تعريف المؤشر
تقييمات العملاء
5.0
التقييمات: 2
5 | 100 % | |
4 | 0 % | |
3 | 0 % | |
2 | 0 % | |
1 | 0 % |
تقييمات العملاء
October 22, 2025
October 21, 2025
The better read comes from the process slows down in a good way. It should stay in the support stack.
مناقشة
الأسئلة الشائعة
BTCUSD
Forex
Signal
Breakout
Indices
EURUSD
Commodities
GBPUSD
NZDUSD
RSI
Fibonacci
Scalping
XAUUSD
NAS100
ATR
MACD
USDJPY
VWAP
يتم توفير المنتجات المتاحة من خلال cTrader Store، بما في ذلك روبوتات التداول والمؤشرات والإضافات، من قبل مطوري الطرف الثالث وإتاحتها لأغراض الوصول المعلوماتي والفني فقط. cTrader Store ليس وسيطًا ولا يقدم نصائح استثمارية أو توصيات شخصية أو أي ضمان للأداء المستقبلي.
المزيد من هذا المؤلف


السعر
منذ 11/10/2025
2.55M
حجم التداول
17.52K
الربح بالبيب
1
المبيعات
230
التثبيتات المجانية