
TrendStrengthSignals
Indikator
Version 1.0, Aug 2025
Windows, Mac
5.0
Bewertungen: 1
Seit 26/05/2025
385.04M
Gehandeltes Volumen
60.66K
Pip-Gewinn
14
Verkäufe
1.39K
Kostenlose Installationen
Beschreibung
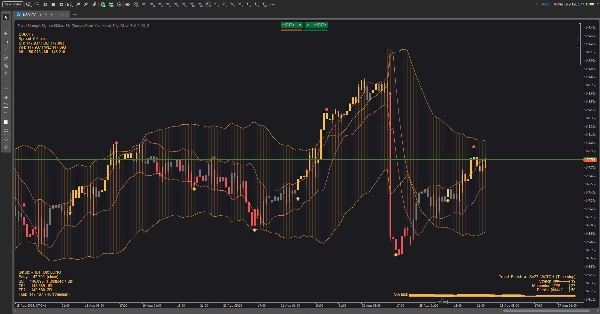
Ein visuelles Toolkit für Trendhandel, das eine Volatilitäts-Hülle mit einem zyklusbewussten Kanal kombiniert, um Regime, Timing und Risiko auf einen Blick zu zeigen. Es ist so gestaltet, dass es auf jedem Hintergrund (hell/dunkel) lesbar ist und den Bildschirm sauber hält, während es Ihnen dennoch Hinweise gibt, „was als Nächstes zu tun ist“.
Was Sie im Chart sehen
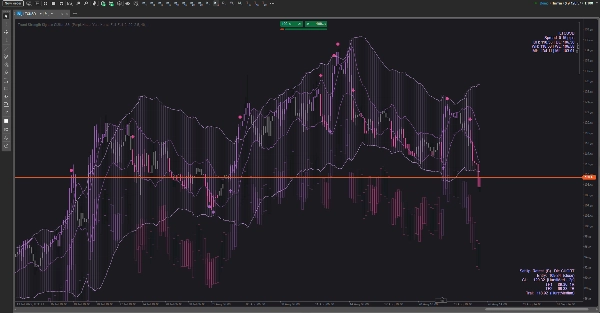
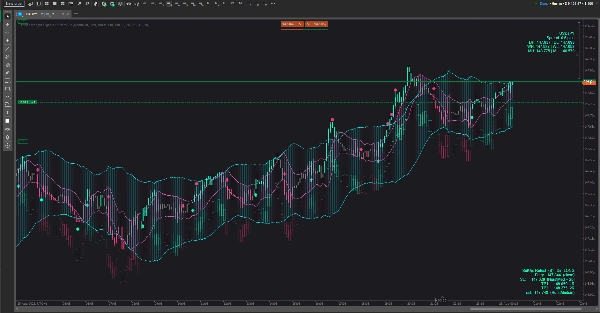
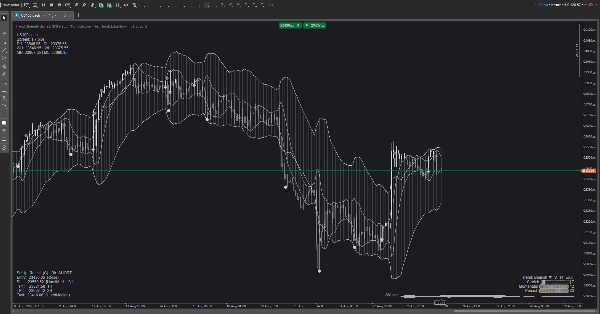
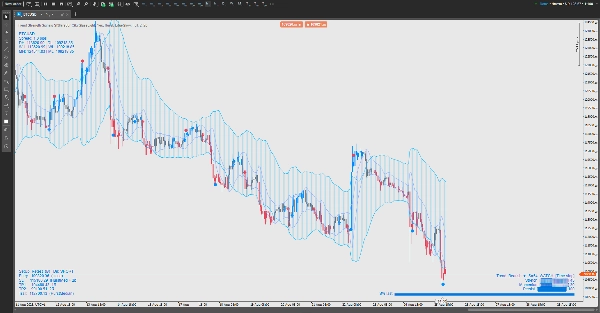
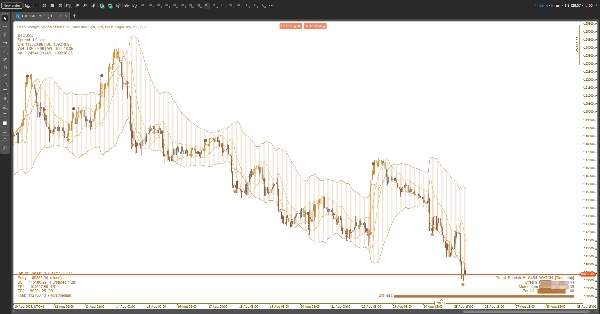
- Wolken (umschaltbar):
-
- Eine Volatilitäts-Wolke, die sich mit der Marktaktivität ausdehnt/zusammenzieht.
- Eine Zyklus-Wolke, die den rollenden Rhythmus des Preises verfolgt.
- Sie können entweder eine, beide oder keine anzeigen.
- Signale: unaufdringliche Auf-/Ab-Pfeile für potenzielle Trendwechsel; kleine Punkte für Take-Profit-Anstöße.
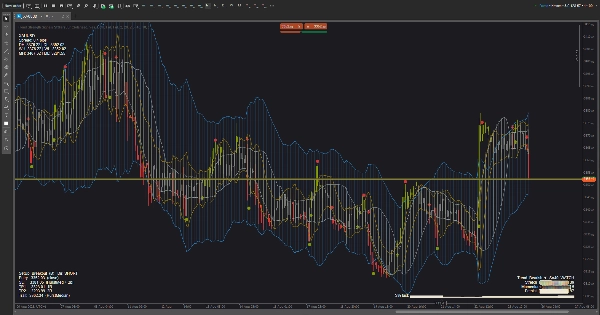
- Trendstärke-HUD (drei Stile):
-
- Light — ein kompakter Status-Tag.
- Pro — ein kleines Dashboard mit drei Messgeräten (Stretch, Momentum, Persistence) plus einer Mini-Historien-Sparkline.
- Ribbon — eine weiche Leiste nahe dem Preis, deren Intensität der Trendstärke folgt.
- Risk-HUD: schlägt eine Richtung, einen Schutzstoppbereich, zwei gestaffelte Gewinnziele und eine optionale Trailing-Idee vor. Es sitzt in jeder Ecke Ihrer Wahl und aktualisiert sich, während sich die Kerze entwickelt.
- Market-HUD: Symbol & Spread sowie Tages-/Wochen-/Monatshoch-Tief-Referenzen, damit Sie immer wissen, wo Sie sich auf der größeren Karte befinden.
- Themen: kuratierte Farbsätze für helle und dunkle Charts (und ein benutzerdefinierter Modus). Alle grafischen Elemente – einschließlich HUDs und Signale – folgen dem aktiven Thema.
Wie man es benutzt (praktisch, nicht technisch)
- Wählen Sie Ihre Wolkenansicht:
-
- Verwenden Sie die Volatilitäts-Wolke, um Squeezes und Ausdehnungen zu sehen.
- Verwenden Sie die Zyklus-Wolke, um „Rand“- vs. „Mittel“-Rotationen zu beurteilen.
- Verwenden Sie beide, wenn Sie Kontext + Timing wünschen.
- Lesen Sie die Trendstärke:
-
- Wenn der Status auf HALTEN ansteigt, bevorzugen Sie Trades in der aktuellen Richtung; wenn er auf BEOBACHTEN fällt, reduzieren Sie die Aggressivität; zeigt er AUSSTIEG, vermeiden Sie neue Trades oder verringern Sie das Risiko.
- Im Pro-Modus bedeuten steigende Messgeräte + steigende Sparkline eine verbesserte Qualität; abnehmende Messgeräte = Risiko reduzieren.
- Zeitpunkte für Einstiege mit Preis vs. Wolke:
-
- Ausbrüche nach Kompression, Wiedereinstiege nach einem höflichen Pullback zur Wolke oder Abpraller von einem äußeren Rand sind die Standardmuster.
- Wenn ein früher Pfeil mitten in der Kerze erscheint und dann verschwindet, warten Sie auf eine Bestätigung beim Kerzenschluss, wenn Sie weniger Fehlsignale bevorzugen.
- Verwalten Sie den Trade mit dem Risk-HUD:
-
- Platzieren Sie den Schutzstopp ungefähr jenseits der nächsten strukturellen Grenze, die das HUD hervorhebt.
- Skalieren Sie bei TP1 aus, lassen Sie den Rest auf TP2 zielen oder folgen Sie der vorgeschlagenen Trailing-Linie.
- Wenn die Trendstärke von stark zu schwach abnimmt, ziehen Sie einen früheren Ausstieg in Betracht.
- Situative Filter:
-
- Vermeiden Sie Einstiege, wenn die Wolken dünn und unruhig sind oder wenn der Stärke-Status auf AUSSTIEG steht.
- Bevorzugen Sie Trades, wenn die Stärke zunimmt, die Wolke geneigt ist und der Preis sauber mit den Rändern interagiert.
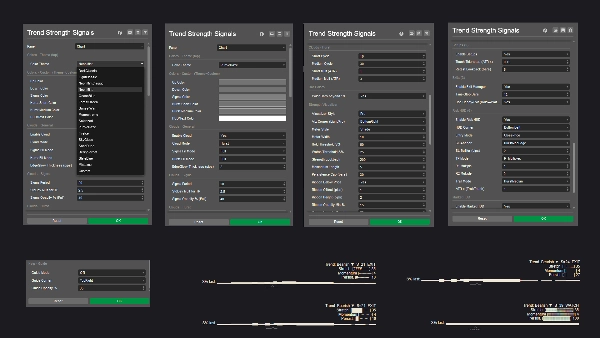
Anpassung
- Wechseln Sie HUD-Ecken, Visualisierungsstil und Farbthema, um Ihren Arbeitsbereich anzupassen.
- Helle Themen halten den Text auf weißen Hintergründen sichtbar; Ozean-/Wald-/Sonnenuntergangspaletten fügen subtilen Kontrast ohne Blendung hinzu.
Was es nicht
Dies ist kein Black-Box-Autotrader. Es ist eine Entscheidungshilfe: Es rahmt die Trendqualität ein, schlägt sinnvolle Risikopositionen vor und hebt Momente mit hoher Wahrscheinlichkeit hervor – aber Sie behalten die Kontrolle.
Zusammenfassung
Indikatorprofil
Kundenbewertungen
5.0
Bewertungen: 1
5 | 100 % | |
4 | 0 % | |
3 | 0 % | |
2 | 0 % | |
1 | 0 % |
Kundenbewertungen
September 2, 2025
The reason it feels usable is direction is easier to respect, and a 1R exit plan makes review easier.
Diskussion
Häufig gestellte Fragen (FAQ)
Über den cTrader Store verfügbare Produkte, einschließlich Handelsbots, Indikatoren und Plugins, werden von externen Entwicklern bereitgestellt und nur zu Informations- und technischen Zugriffszwecken verfügbar gemacht. cTrader Store ist kein Broker und erbringt keine Anlageberatung, persönlichen Empfehlungen oder eine Garantie für zukünftige Performance.


Preis
Seit 26/05/2025
385.04M
Gehandeltes Volumen
60.66K
Pip-Gewinn
14
Verkäufe
1.39K
Kostenlose Installationen