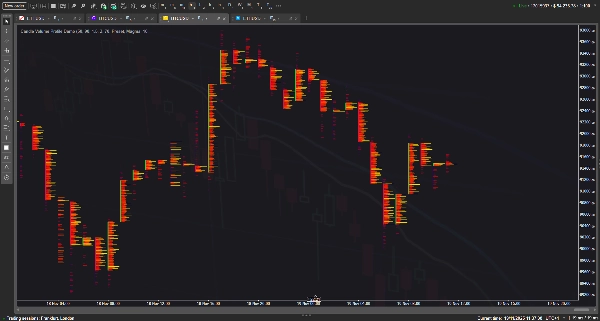
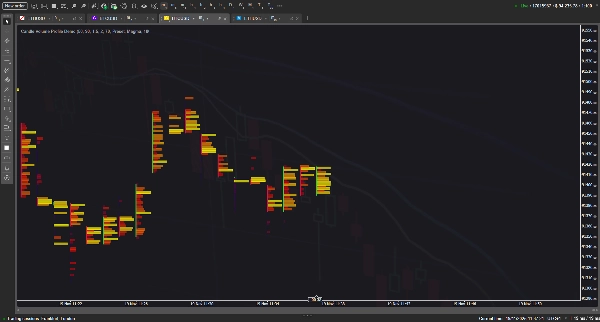
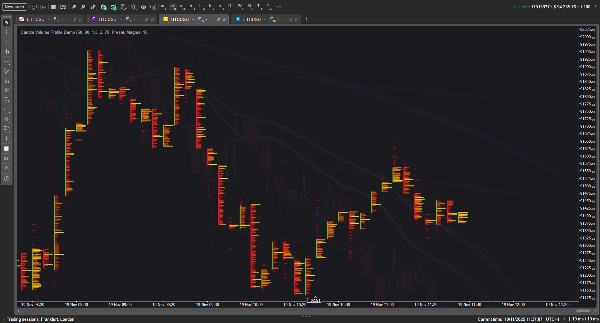
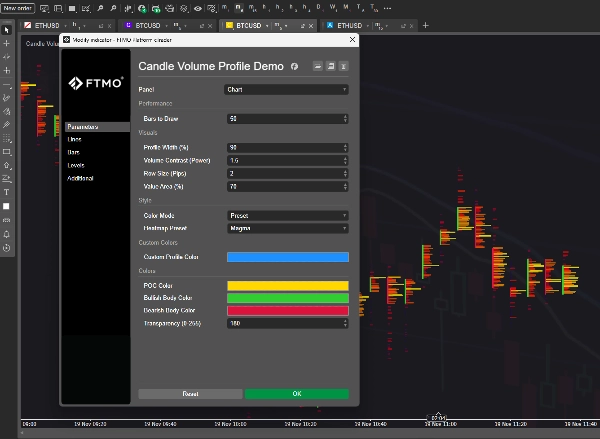
Candle Volume Profile Demo
Indikator
245 downloads
Version 1.0, Nov 2025
Windows, Mac
4.0
Bewertungen: 1
In „Candle Volume Profile Demo“ hochgeladenes BildIn „Candle Volume Profile Demo“ hochgeladenes BildIn „Candle Volume Profile Demo“ hochgeladenes BildIn „Candle Volume Profile Demo“ hochgeladenes Bild
Seit 26/05/2025
337.3M
Gehandeltes Volumen
58.68K
Pip-Gewinn
11
Verkäufe
900
Kostenlose Installationen

This indicator visualizes the Volume Profile for individual bars, transforming standard candlesticks into a detailed 'footprint' style chart with customizable heatmaps, Point of Control (POC) lines, and Value Area blocks to highlight volume distribution per price level. It aims to emulate professional order flow tools by using heuristic volume distribution to render market activity directly on the chart.

Theoretically, this concept should work seamlessly to provide deep market insights; however, in practice, due to the immense number of graphical objects required for rendering, the more features and history depth you demand from this indicator, the more it tends to lag and cause terminal instability. :(

4.0
Bewertungen: 1
5
0 %
4
100 %
3
0 %
2
0 %
1
0 %
Kundenbewertungen
November 24, 2025
Candle Volume Profile Demo gives you a clean visual of volume distribution inside candles/ranges - a smart add-on for liquidity-aware traders. The visualization is sharp and performance solid, but as a demo version it lacks full features (history logs, advanced filters). Best when paired with structure and confirmation tools. A good starting point, ready to level up.
VWAP
ZigZag
FVG
ATR
Signal
Crypto
BTCUSD

Mehr von diesem Autor

Indikator
NAS100
Indices
Prop
+6
VolumeThermometer
Heatmap of intra-HTF volume (POC/VA) built from LTF tick data; paints current candle and auto-loads visible history.
Indikator
NAS100
NZDUSD
XAUUSD
+13
Side Volume Profile
Right-anchored cTrader Volume Profile with VAH/VAL/POC, LVZ, top volume+EMA, themes, and fast, readable visuals.
Indikator
NAS100
NZDUSD
XAUUSD
+12
VSA
Pro VSA tool with 3 modes: Fixed Ratios, Standard Deviation & Contextual VSA.
Candles_Painter
Overlay HTF context on any chart: color bars by HTF and draw filled HTF bodies with optional High/Low lines.
Moving Average Plus
10 configurable moving averages: choose type, period, color per line; single price source for all.
Indikator
NAS100
NZDUSD
Breakout
+19
Session Plus HL
Session boxes, liquidity sweeps and higher‑timeframe levels for intraday trading
Market Entropy
Market entropy + DC. Spot crystallization/chaos shifts with an optional on-chart overlay.
TrendStrengthSignals
Edge-aware clouds + Pro HUD: better entries, calmer exits, adaptive risk.
Indikator
NAS100
NZDUSD
XAUUSD
+16
Candle Timer Toolbox
A multi-TF panel with candle timers, sessions, ticker, spread & 15+ themes. Fully customizable.
Indikator
NAS100
NZDUSD
XAUUSD
+14
Donchian Channel Pro
Tracks N-period highs/lows, HTF overlay, HUDs with ADX, RSI, session clocks. Customizable for precise trading.

Das könnte Sie auch noch interessieren

Indikator
Indices
Forex
Signal
+2
Golden Boom And Crash Spike Detector
Golden Boom and Crash Spike Detector is a trading tool designed for Crash 300 and Boom 300 indices on M1 Timeframe.
Vsamarth Indi
One‑click RSI robot for consistent rapid‑fire trades.
Indikator
RSI
XAUUSD
Breakout
+4
S&R Structural ZigZag
"Detects swings 🎯, draws zigzag trends 📈📉, support/resistance ⏹️, labels HH/HL/LH/LL, Tracks market structure 🚀🐻."
Volume Edge Pro
Pro Volume Profile with Delta, Session Filters & CSV Export. Precision order flow analysis.
Indikator
NAS100
NZDUSD
Indices
+9
Supply and Demand
Auto Supply and Demand Automatically identifies the zones of highest trading activity on your chart. 📊
Indikator
NAS100
NZDUSD
XAUUSD
+10
Moving Average PRO
Customize your Moving Average! Choose any timeframe and price source for precision and flexibility in your analysis.
Indikator
Indices
Prop
Commodities
+3
PivotLevels
It draws Pivot Levels on the chart.
Tabajara corrigido[fix]
corrigido todos os bugs e cores invertidas tabajara antigo deleetado
Indikator
Breakout
AutoLines™ Support & Resistance
FlexSR auto‑detects pivot highs/lows to plot dynamic support & resistance lines Features customizable styling and option
Break of Structure
The Break of Structure (BoSCHoCh) Indicator is a smart market structure tool designed to help traders easily spot trend.
Indikator
Signal
dark-cloud
The Dark Cloud Cover indicator detects a bearish reversal pattern, marking key candles and confirming signals based on v
Beste Ratings
Kostenlos
Indikator
ATR
Supertrend
PMAX
It's a combination of two trailing stop loss and the other one is well-known ATR-based SuperTrend.
Seit 26/05/2025
337.3M
Gehandeltes Volumen
58.68K
Pip-Gewinn
11
Verkäufe
900
Kostenlose Installationen