
Beschreibung
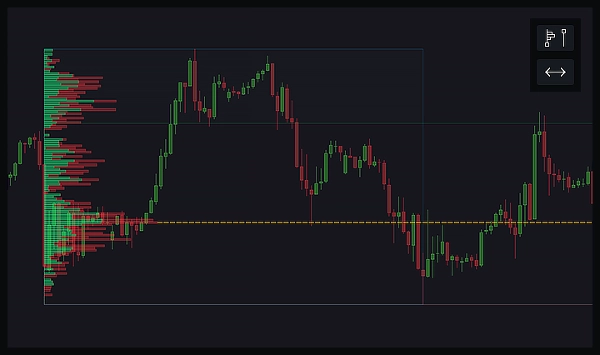
Ein Fixed Range Volume Profile ist ein Werkzeug, das zeigt, wie viel Handelsaktivität auf verschiedenen Preisniveaus innerhalb eines bestimmten Bereichs auf einem Chart stattgefunden hat. Sie zeichnen ein Rechteck über den Bereich, der Sie interessiert, und das Profil zeigt horizontale Balken an, die das Handelsvolumen auf jedem Preisniveau innerhalb dieses Bereichs darstellen. Dies hilft Ihnen zu sehen, wo am meisten gekauft und verkauft wurde, und hebt wichtige Preisniveaus hervor, die für Handelsentscheidungen relevant sein könnten.
Wichtige Komponenten des Fixed Range Volume Profile sind:
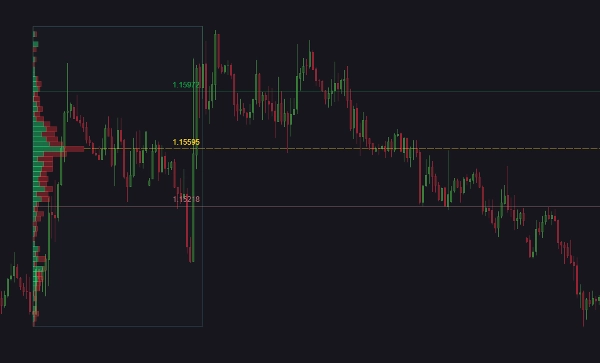
- Point of Control (POC): Das Preisniveau mit dem höchsten Handelsvolumen innerhalb des ausgewählten Bereichs. Dies wird oft als bedeutendes Unterstützungs- oder Widerstandsniveau angesehen, da es einen Preis widerspiegelt, an dem viel Handelsaktivität stattfand.
- Value Area High (VAH): Die obere Grenze des Preisbereichs, in dem 70 % des gesamten Handelsvolumens stattfanden. Preise über diesem Niveau gelten als weniger gehandelt und potenziell überbewertet.
- Value Area Low (VAL): Die untere Grenze des Preisbereichs, in dem 70 % des gesamten Handelsvolumens stattfanden. Preise unter diesem Niveau gelten als weniger gehandelt und potenziell unterbewertet.
Diese Linien helfen Händlern, bedeutende Preisniveaus zu identifizieren, die als Unterstützung oder Widerstand wirken können. Indem sie verstehen, wo der Großteil des Handelsvolumens konzentriert ist, können Händler fundiertere Entscheidungen über potenzielle Kursbewegungen, Ein- und Ausstiegspunkte treffen.
Zum Beispiel kann, wenn der aktuelle Preis nahe dem POC liegt, dies auf ein starkes Unterstützungs- oder Widerstandsniveau hinweisen. Befindet sich der Preis innerhalb des Value Area, deutet dies darauf hin, dass er sich in einem fairen Wertbereich befindet, während Preise außerhalb des Value Area als potenzielle Ausbruchs- oder Einbruchspunkte angesehen werden könnten.
Was dieser Indikator macht:
Dieser Indikator erweitert Ihr Handelschart mit einer leistungsstarken Volumenprofilanalyse und anpassbaren Alarmen. Mit zwei intuitiven Schaltflächen können Sie einfach Fixed Range Volume Profiles zeichnen und Schlüsselbereiche unendlich erweitern oder verkleinern. Das Volumenprofil kann in zwei verschiedenen Modi visualisiert werden, Gesamtvolumen oder Auf- und Abwärtsbalken. Passen Sie die Anzahl der Ebenen, die Datenauflösung (Präzise oder Schnell) und die Größe des Value Area nach Ihren Bedürfnissen an.
Magnetische Bereiche aktualisieren sich automatisch basierend auf der letzten Kerze, sodass Ihre Analyse stets aktuell bleibt. Sie können auch das Aussehen und Verhalten des Profils und seiner Komponenten, einschließlich POC-, VAH- und VAL-Linien, anpassen. Alarme können bei Preisberührungen eingestellt werden, mit Optionen zum Auslösen von Aktionen wie dem Starten oder Stoppen von cBots und dem Schließen von Positionen. Alarme können per Ton, cTrader-Pop-ups, Telegram-Nachrichten (mit optionalen Screenshots) und E-Mails zugestellt werden.
Funktionen:
- Fixed Range Volume Profile: Zeichnen Sie ein Rechteck, um das Volumenprofil eines ausgewählten Bereichs zu visualisieren.
- Linien erweitern/verkleinern: Erweitern oder verkleinern Sie POC-, VAH- und VAL-Linien bis ins Unendliche.
- Volumenprofil-Modi: Wählen Sie zwischen Gesamtvolumen oder Auf- und Abwärtsbalken.
- Anpassbare Ebenen und Auflösung: Wählen Sie die Anzahl der Ebenen und die Auflösung (Präzise oder Schnell).
- Anpassbarer Value Area: Legen Sie die Größe des Value Area fest.
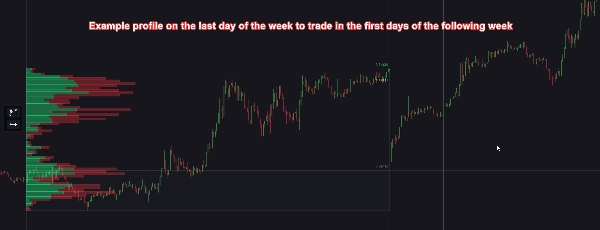
- Magnetische Bereiche: Passen Sie Bereiche automatisch an die letzte Kerze an, aktualisiert alle 1–10 Minuten oder beim Kerzenschluss.
- Anpassbares Erscheinungsbild: Ändern Sie Position, Größe und Stil von Schaltflächen, Linien und Volumenbalken.
- Alarme bei Preisberührungen: Lassen Sie sich benachrichtigen, wenn der Preis POC-, VAH- oder VAL-Linien berührt.
- cBot-Integration: Starten oder stoppen Sie cBots basierend auf Alarmen.
- Positionsverwaltung: Schließen Sie Positionen bei Alarmen mit anpassbaren Optionen für jede Linie (POC, VAH und VAL).
- Alarmmethoden: Erhalten Sie Alarme per Ton, cTrader-Pop-ups, Telegram-Nachrichten (mit optionalen Screenshots) und E-Mails.
- Leistungsoptimierung: Option zum automatischen Löschen vergangener Bereiche, die im Chart nicht sichtbar sind, zur Leistungsverbesserung.
- Globale Alarmsteuerung: Einfaches Ein- oder Ausschalten aller Alarme dieses Indikators.
- Benutzerhandbuch: Sie können das Benutzerhandbuch dieses Indikators einfach über eine kleine Schaltfläche im Chart öffnen.
Zusammenfassung
The indicator offers two visualization modes: total volume or separate up and down volume bars. It features customizable settings for the number of volume levels, data resolution (Precise or Fast), and value area size. Magnetic ranges automatically update based on the latest candle to keep analysis current. Users can expand or contract POC, VAH, and VAL lines infinitely.
Alerts can be configured for price touches on these key levels, with notifications via sound, platform pop-ups, Telegram (including optional screenshots), and email. Alerts can trigger actions such as starting/stopping cBots or closing positions. The indicator also supports customizable appearance, performance optimization by auto-deleting out-of-view ranges, and global alert control. A user guide is accessible directly from the chart interface.
Kundenbewertungen
5 | 67 % | |
4 | 0 % | |
3 | 33 % | |
2 | 0 % | |
1 | 0 % |


