
Beschreibung
Revolutionieren Sie Ihr Trading mit dem ultimativen cTrader Chart Pattern Indikator
Bringen Sie Ihre Handelsstrategie mit diesem hochmodernen cTrader Indikator auf die nächste Stufe, der fachmännisch entwickelt wurde, um kritische Chartmuster für eine präzise Marktanalyse zu erkennen und hervorzuheben. Dieses fortschrittliche Tool identifiziert wichtige Muster wie Double Tops, Head and Shoulders, Ascending Triangles und mehr und bietet Tradern einen starken Vorteil im Forex, Aktienhandel und allen auf der cTrader-Plattform verfügbaren Märkten.
Hauptmerkmale:
- Automatische Erkennung von Chartmustern: Erkennen Sie sofort Muster wie Bullische Flaggen, Symmetrische Dreiecke und Steigende Keile.
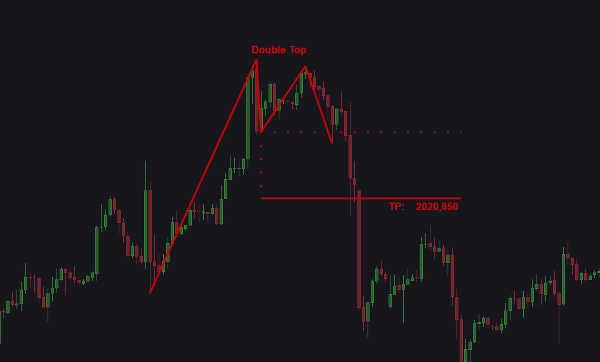
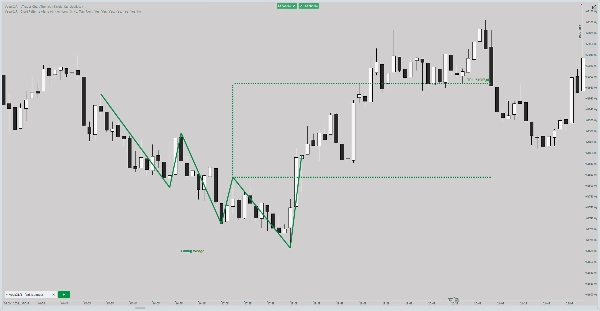
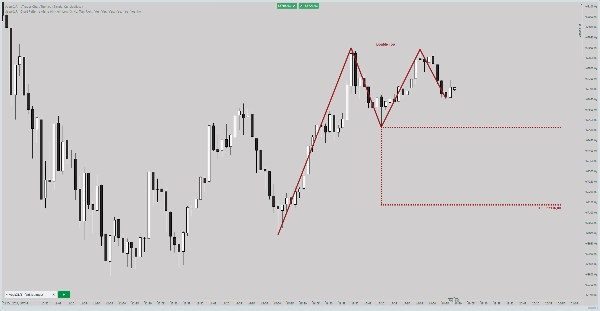
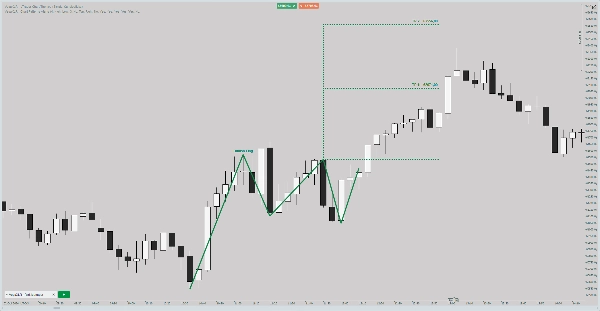
- Muster-Swing-Darstellung: Visualisieren Sie Halslinien, Ziel-Linien und Preisbewegungen mühelos.
- Anpassbare Alarme: Bleiben Sie informiert mit Alarmen via Sound, Pop-up, Telegram oder E-Mail— maßgeschneidert auf Ihre Bedürfnisse.
- Farbkodierte Einblicke: Unterscheiden Sie schnell zwischen bullischen, bärischen und neutralen Mustern mithilfe anpassbarer Farbschemata.
- Musterliste mit Statistiken: Verfolgen Sie Musterhäufigkeiten einfach mit einer integrierten Liste, die Abkürzungen und Zählungen anzeigt.
- Anpassbare Zoomstufen: Konzentrieren Sie sich auf bestimmte Mustergößen für eine detaillierte Analyse.
- Anzeige des Gewinnpotenzials: Bewerten Sie potenzielle Handelsmöglichkeiten mit klaren Gewinnangaben.
- Klarheit bei Zeitrahmen und Symbol: Alarme enthalten präzise Details zum Symbol und Zeitrahmen für fundierte Entscheidungen.
- Option zum Pausieren von Alarmen: Analysieren Sie Muster ohne Ablenkungen, indem Sie Benachrichtigungen pausieren.
- Benutzer-Notizfunktion: Fügen Sie Kommentare zur Strategieoptimierung oder musterspezifische Notizen hinzu.
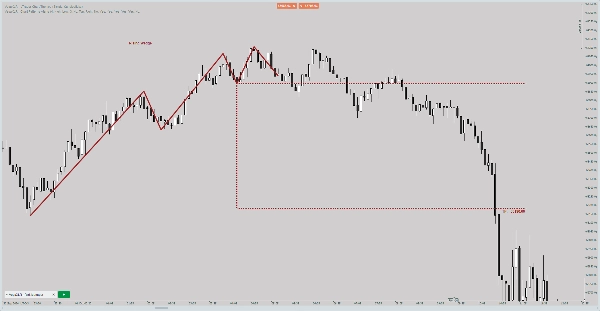
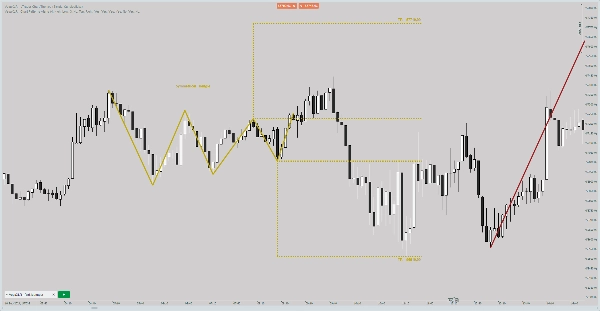
Erkannte Chartmuster:
- Double Top
- Double Bottom
- Head and Shoulders
- Inverse Head and Shoulders
- Symmetrisches Dreieck
- Aufsteigendes Dreieck
- Absteigendes Dreieck
- Bullische Flagge
- Bärische Flagge
- Steigender Keil
- Fallender Keil
Dieser intuitive Trading-Indikator ermächtigt Trader, indem er automatisierte Chartmustererkennung, anpassbare Alarme und Echtzeit-Visualisierungen kombiniert. Egal, ob Sie im Forex-Markt handeln, Aktiencharts analysieren oder cTrader Custom Indicators erkunden, dieses Tool liefert die Einblicke, die Sie benötigen, um klügere und selbstbewusstere Entscheidungen zu treffen. Perfekt für Trader, die die technische Analyse meistern und ihre Risikomanagement Strategien optimieren möchten.
Entfesseln Sie noch heute Ihr Trading-Potenzial mit diesem umfassenden cTrader-Indikator!
Warnung:
Dieser Indikator ist ein Werkzeug für technische Analyse, das entwickelt wurde, um Trader durch Einblicke und Visualisierungen basierend auf Chartmustern und Marktdaten zu unterstützen. Er funktioniert nicht als eigenständige Trading-Lösung und garantiert keine profitablen Ergebnisse. Nutzer müssen eigene Handelsstrategien, Risikomanagement und Entscheidungsprozesse bei der Verwendung dieses Produkts umsetzen. Die vergangene Performance ist kein Indikator für zukünftige Ergebnisse. Der Handel an Finanzmärkten birgt erhebliche Risiken, und Sie sollten nur mit Kapital handeln, dessen Verlust Sie sich leisten können.
Zusammenfassung
Key functionalities include automatic pattern detection, real-time visualization of pattern components like necklines and target lines, and customizable alerts delivered via sound, pop-up, Telegram, or email. It features color-coded insights to distinguish bullish, bearish, and neutral patterns, a pattern list with occurrence statistics, adjustable zoom levels for detailed analysis, and profit potential display to evaluate trade opportunities. Alerts provide clear symbol and timeframe information, and users can pause notifications or add personal notes for strategy refinement.
This tool assists traders in technical analysis and risk management by providing actionable insights based on chart patterns. It is intended as a supportive tool and does not function as a standalone trading solution. Users must apply their own trading strategies and risk controls when using this indicator.
Kundenbewertungen
5 | 67 % | |
4 | 0 % | |
3 | 33 % | |
2 | 0 % | |
1 | 0 % |


