

Money Flow Profile
Indikator
Version 1.0, Jul 2026
Windows, Mac

534.4M
Gehandeltes Volumen
9.76M
Pip-Gewinn
4
Verkäufe
Beschreibung
📊 Geldflussprofil
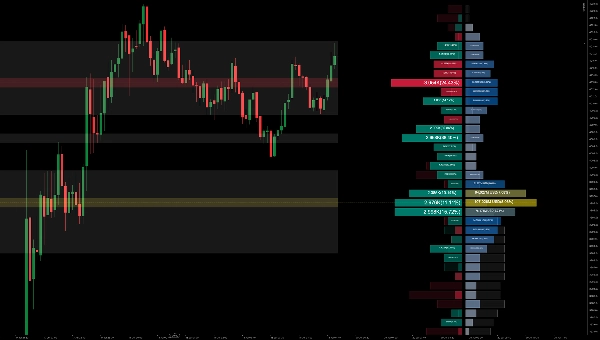
Das Geldflussprofil ist ein fortschrittliches Charting-Tool, das das gehandelte Volumen oder den Geldfluss auf allen Preisniveaus am Markt über einen festgelegten Zeitraum misst. Es hebt die Beziehung zwischen dem Preis des Vermögenswerts und der Kauf- oder Verkaufsbereitschaft der Händler hervor und ermöglicht Ihnen:
- Wichtige Preisniveaus erkennen: Identifizieren Sie einfach Volumencluster und Knoten mit hoher Liquidität wie den Point of Control (POC).
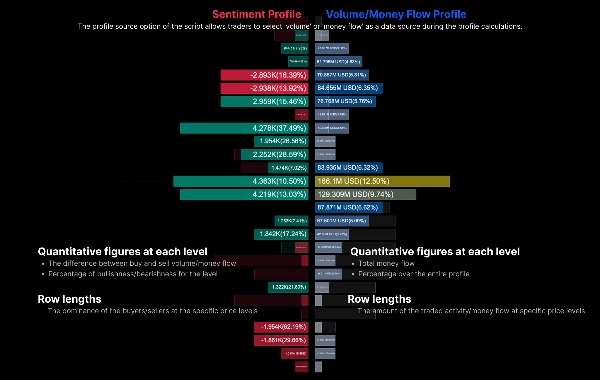
- Marktstimmung analysieren: Durch die Anzeige eines Stimmungsprofils links und eines Volumenprofils rechts wird bestimmt, ob Käufer oder Verkäufer auf jedem spezifischen Preisniveau dominieren.
- Vergleich über Perioden: Vergleichen Sie das aktuelle Profil direkt mit dem Geisterprofil der vorherigen Periode, um Verschiebungen im Schwerpunkt des Marktes zu beobachten.
⚙️ Kernparameter & Gebrauchsanleitung
1. Allgemeine Einstellungen
- Lookback-Länge / Fester Bereich: Definiert die Anzahl der historischen Balken, die zur Berechnung des Profils verwendet werden (z. B. die letzten 200 Balken).
- Datenquelle:
-
1 = Volumen: Berechnet das Profil basierend auf traditionellem Tick-/Handelsvolumen.2 = Geldfluss: Bezieht die Preistiefe ein, um die Verteilung des Geldflusses zu berechnen.
2. Profileinstellungen
- Zeilenauflösung (Zeilen): Bestimmt die Granularität der vertikalen Achse. Eine höhere Zahl (z. B. 50-100) führt zu einem detaillierteren Profil.
- Profilbreite & Horizontale Verschiebung: Passt an, wie breit das Profil gezeichnet wird (als Prozentsatz) und wie weit es nach rechts versetzt ist, um eine Überlappung mit der aktuellen Kerze zu vermeiden.
3. Stimmung & Anzeige
- Stimmungspolarität:
-
1 = Kerze: Bestimmt die bullische/bärische Stimmung rein basierend auf dem Eröffnungs- und Schlusskurs der Kerze (Polarität).2 = Kauf-/Verkaufsdruck: Verwendet eine genauere Berechnung unter Einbeziehung von Dochten und dem Schlusskurs relativ zum Hoch/Tief.
- Stimmungsprofil / Volumenprofil anzeigen: Unabhängige Umschalter zur Anzeige des Nettostimmungsprofils (links) und des Hauptvolumenprofils (rechts).
- Vorherige Periode anzeigen: Wenn aktiviert, wird ein Hintergrund-"Geisterbalken"-Profil gezeichnet, das das exakt gleiche Zeitfenster der vorherigen Periode darstellt. Ideal, um Verschiebungen bei Unterstützung/Widerstand zu verfolgen.
4. Erweiterte Bereichsanzeige
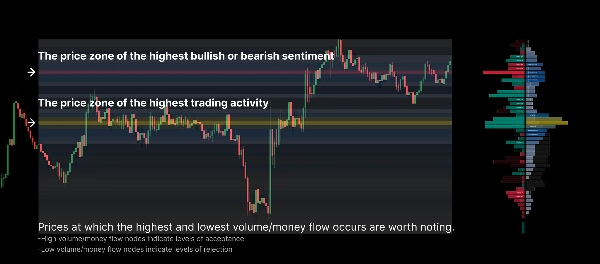
- Heatmap anzeigen: Projiziert die Profildichte über den gesamten Berechnungszeitraum als Hintergrund-Heatmap. Sie können wählen, ob "Volumen" oder "Stimmung" projiziert wird.
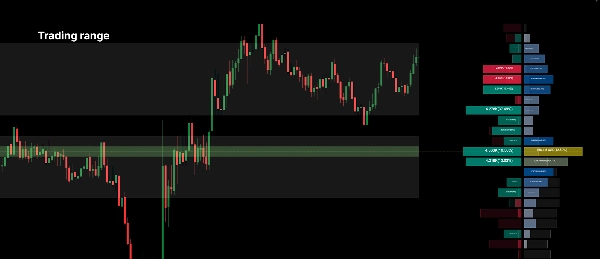
- Wertbereich anzeigen: Hebt den Kernpreisbereich hervor, in dem das meiste Handelsvolumen stattfand. Der Schwellenwert ist anpassbar (z. B. 70%).
- POC-Zone anzeigen: Zeichnet automatisch eine horizontale Linie und Zone am Point of Control (dem Preisniveau mit dem höchsten Volumen) für den ausgewählten Bereich.
💡 Praktische Trading-Tipps:
- Achten Sie auf Knoten mit hohem Volumen (Peaks) als starke Unterstützungs- oder Widerstandsniveaus.
- Achten Sie auf Knoten mit niedrigem Volumen (Täler), da sich der Preis durch diese Zonen mit geringer Liquidität meist schnell bewegt.
- Verwenden Sie das Geisterprofil der vorherigen Periode: Wenn der aktuelle POC (gelbe Linie) höher als der POC der vorherigen Periode liegt, deutet dies darauf hin, dass sich der Wertkonsens nach oben verschiebt, was allgemein ein bullisches Signal ist.
Zusammenfassung
AI summary
Money Flow Profile is an advanced indicator that maps traded volume and market sentiment across price levels over a specified time period. It visualizes the relationship between price and trader activity, highlighting key liquidity zones such as volume clusters and the Point of Control (POC). The tool displays a Sentiment Profile on the left and a Volume Profile on the right, enabling users to assess whether buyers or sellers dominate at each price level. It supports direct comparison with the previous period’s profile via a ghost overlay to track shifts in market value consensus.
Core configurable parameters include lookback length, data source selection (volume or money flow), row resolution for vertical granularity, profile width and offset, and sentiment polarity calculation methods (candle-based or buy/sell pressure). Display options allow toggling of sentiment and volume profiles, previous period overlays, heatmaps of volume or sentiment density, value area highlighting, and automatic POC zone marking.
The indicator is designed to help identify strong support and resistance levels at high volume nodes and anticipate rapid price movements through low volume nodes. It supports detailed volume and sentiment analysis to inform trading decisions based on liquidity and market structure.
Core configurable parameters include lookback length, data source selection (volume or money flow), row resolution for vertical granularity, profile width and offset, and sentiment polarity calculation methods (candle-based or buy/sell pressure). Display options allow toggling of sentiment and volume profiles, previous period overlays, heatmaps of volume or sentiment density, value area highlighting, and automatic POC zone marking.
The indicator is designed to help identify strong support and resistance levels at high volume nodes and anticipate rapid price movements through low volume nodes. It supports detailed volume and sentiment analysis to inform trading decisions based on liquidity and market structure.
Indikatorprofil
Indikatorkategorie
Volumen
Ausgabetyp
Visualisierung
Datenanforderungen
Volumen
DoM
Nur Balken
Tick-Daten
Unterstützte Signale
Ausbruch
Trendstärke
Wendepunkt
Volatilität
Level – Berührung
Level – Durchbrechen
Kundenbewertungen
0.0
Bewertungen: 0
Kundenbewertungen
Bisher gibt es keine Bewertungen für dieses Produkt. Haben Sie es schon ausprobiert? Dann können Sie die erste Person sein, die andere darüber informiert!
Diskussion
Häufig gestellte Fragen (FAQ)
Key Levels
Volume
Über den cTrader Store verfügbare Produkte, einschließlich Handelsbots, Indikatoren und Plugins, werden von externen Entwicklern bereitgestellt und nur zu Informations- und technischen Zugriffszwecken verfügbar gemacht. cTrader Store ist kein Broker und erbringt keine Anlageberatung, persönlichen Empfehlungen oder eine Garantie für zukünftige Performance.
Mehr von diesem Autor






















Preis
534.4M
Gehandeltes Volumen
9.76M
Pip-Gewinn
4
Verkäufe