
Beschreibung
🌐 DOMINIEREN SIE DEN MARKT MIT INSTITUTIONELLEM FLOW-READING
Was es zeigt: tatsächlich ausgeführte Trades — echter Fluss der Aggression.
Vorteile: Dieser Indikator wird durch Tick-Daten dargestellt.
Stellt Geld dar, das bereits im Markt gebunden ist.
Klassifiziert Aggressoren (Käufer/Verkäufer trifft das Ask/Bid).
Erkennt Absorption, Erschöpfung, Beschleunigung des Flusses.
📈Kombinieren Sie mit den kostenlosen Indikatoren, Volumen bei Preis, Volume Squeezer.
https://ctrader.com/products/2514 https://ctrader.com/products/2874
Order Flow
Tape Reading
Ladder DOM
Institutionelle Absorption
Intelligente Ausbrüche
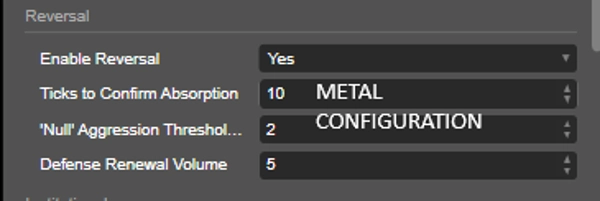
Flow-Umkehrungen
Kauf- und Verkaufsdruck
Echtzeit-Aggressionsanalyse
Das System verwandelt das traditionelle Chart in ein echtes institutionelles Marktlesezentrum.
UNTERSCHIED DES ALGORITHMUS
Während gewöhnliche Indikatoren nur Kerzen analysieren, interpretiert Tape Reading Scalper:
✅ Echte Aggression von Käufern und Verkäufern
✅ Flussgeschwindigkeit
✅ Institutionelle Verteidigung
✅ Order-Absorption
✅ Ladder-Beschleunigung
✅ Durch Fluss bestätigte Ausbrüche
✅ Umkehrungen durch Erschöpfung
✅ Institutioneller vs. privater Druck
✅ Intelligente Lot-Skalierung
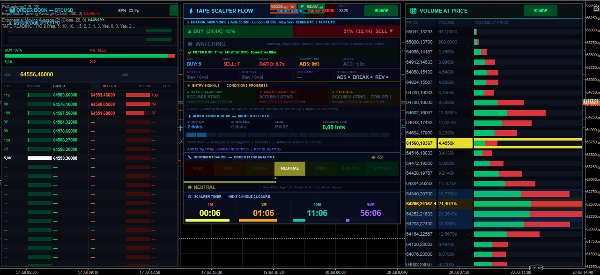
SYSTEMSTRUKTUR
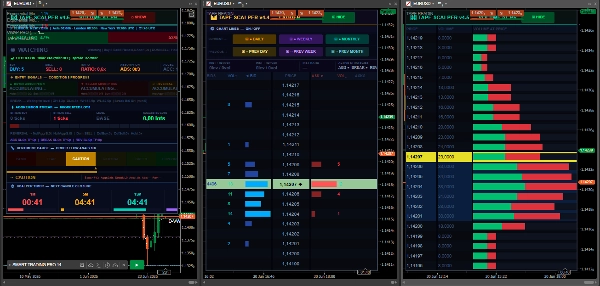
Der Algorithmus verfügt über 2 unabhängige professionelle Panels:
⚡ FLOW-PANEL (FENSTER 1)
Panel verantwortlich für operative Lesung und Signalgenerierung.
Zeigt an:
Käufer-/Verkäuferfluss
Absorption
Umkehrung
Ausbruch
Aggressionsserie
Marktsitzungen
Kauf-/Verkaufsverhältnis
Ladder-Beschleunigung
Dynamischer SL/TP
Operative Filter
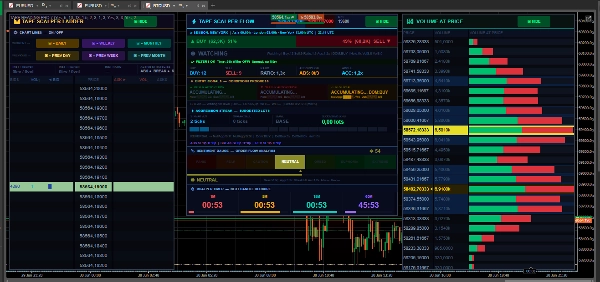
📊 LADDER-PANEL (FENSTER 2)
Institutionelles Panel fokussiert auf:
DOM Ladder
Institutionelle Levels
Volumen nach Preis
Institutioneller Druck
POC
Range
Tages- und Wochenhoch/-tief
Preisbuch
Institutionelle Hitze
ERKLÄRUNG DER LADDER-FUNKTIONEN
1. KAUFAGGRESSION
Zeigt die aktuelle Käuferaggression.
Wenn sie schnell ansteigt:
Käufer steigen stark ein. Der Markt kann nach oben beschleunigen. Deutet auf einen möglichen Ausbruch hin.
Je höher die Zahl:
➡ größerer Kaufdruck.
2. VERKAUFSAGGRESSION
Zeigt Verkäuferaggression.
Wenn sie schnell wächst:
Verkäufer dominieren
Mögliche Fortsetzung des Falls
Institutioneller Short-Einstieg
3. KAUF/VERKAUF-VERHÄLTNIS
Zeigt das Verhältnis zwischen Käufern und Verkäufern.
Beispiel:
Verhältnis 2.0x = Käufer dominieren
Verhältnis 3.0x = starker institutioneller Druck
Verhältnis unter 1,0 = Verkäufer dominieren
Interpretation:
Verhältnis-Interpretation
1,0 Gleichgewicht
1,5 Moderater Druck
2,0+ Starker Trend
3,0+ Starker institutioneller Fluss
4. ABSORPTION
Eine der mächtigsten Funktionen des Algorithmus.
Das System erkennt, wenn:
Ein großes aggressives Volumen vorhanden ist
Aber der Preis sich NICHT bewegt
Das bedeutet:
➡ Institutionelle Investoren absorbieren Orders.
KAUFERABSORPTION
Der Markt erhält viel Verkauf, aber:
Der Preis hört auf zu fallen. Institutionelle Verteidigung tritt auf. Mögliche Umkehr zum Kauf.
Signal:
▲ KAUFERABSORPTION
VERKÄUFERABSORPTION
Der Markt erhält viel Kauf, aber:
Der Preis steigt nicht. Verkäufer halten die Bewegung zurück. Mögliche Umkehr zum Verkauf.
Signal:
▼ VERKÄUFERABSORPTION
5. LADDER-BESCHLEUNIGUNG
Misst die Flussgeschwindigkeit im DOM.
Der Algorithmus vergleicht:
Aktuellen Fluss
mit vorherigem Fluss
Wenn er beschleunigt:
➡ Wahrscheinlicher institutioneller Einstieg.
Beispiel:
Wert Bedeutung
1.0x Normaler Fluss
1.5x Starke Beschleunigung
2.0x+ Institutionelle Explosion
6. AUSBRUCHSERKENNUNG
Erkennt echte Ausbrüche.
Das System validiert:
✅ Volumen
✅ Aggression
✅ Geschwindigkeit
✅ Serie
✅ Institutioneller Fluss
✅ Ladder-Beschleunigung
AUSBRUCH KAUF
Bedingungen:
Starke Kaufaggression Ladder beschleunigt Institutioneller Druck Ausbruch des Hochs
Ergebnis:
➡ Validierter Kauf-Einstieg.
AUSBRUCH VERKAUF
Bedingungen:
Starker Verkaufsdruck Verkauf institutioneller Fluss Unterstützungsausbruch
Ergebnis:
➡ Verkauf bestätigt.
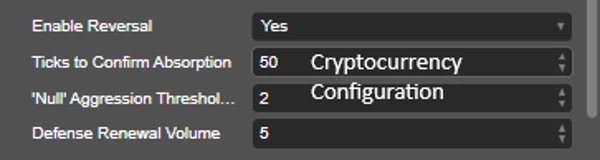
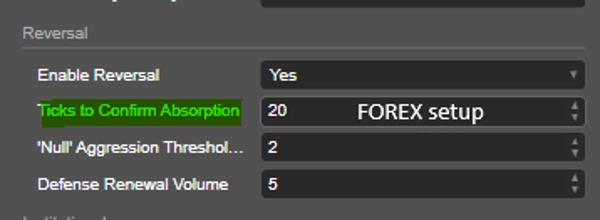
7. UMKEHRERKENNUNG
Erkennt Umkehrungen aufgrund von Erschöpfung.
Das System identifiziert:
Aggression verschwindet Institutionelle Verteidigung tritt auf Verlust der Trendstärke
Ergebnis:
➡ Erwartete Umkehr.
8. SERIENSYSTEM
Intelligentes System zur Flusskontinuität.
Zählt, wie viele aufeinanderfolgende Ticks auftraten:
Kontinuierlicher Kauf
oder
Kontinuierlicher Verkauf
SERIENLEVEL
Level Bedeutung
Level 1 Anfangstrend
Level 2 Starker Fluss
Level 3 Explosive Bewegung
9. VORGESCHLAGENE LOTS
Der Algorithmus schlägt automatisch vor:
erhöhte Lotgröße
reduziertes Risiko
operative Skalierung
Basierend auf:
✅ Flussstärke
✅ Kontinuität
✅ Institutionelle Intensität
11. POC (POINT OF CONTROL)
Zeigt den Preis mit dem höchsten Handelsvolumen.
Bedeutung:
Starke Unterstützung/Widerstand
Institutionelle Zone
Verteidigungsregion
12. TÄGLICHE/WÖCHENTLICHE LEVELS
Automatische Linien für:
Tageshoch
Tagestief
Wochenhoch
Wochentief
Verwendet für:
✅ Ausbrüche
✅ Umkehrungen
✅ Liquidität
✅ Stop-Loss-Orders
13. INSTITUTIONELLER FILTER
Fortgeschrittener institutioneller Filter.
Unterschied:
Privater Fluss
vs institutioneller Fluss
Das System validiert:
✅ Institutionelle Cluster
✅ Volumen pro Level
✅ Dominanter Druck
📈Verwenden Sie diesen Indikator als Bestätigung für den Einstieg in Ihre Strategie. Es lohnt sich, die Bedeutung der Analyse von Fluss, Absorptionssignalen, Tape-Geschwindigkeit und Aggression in Ticks sowie das Sentiment hervorzuheben.
Zusammenfassung
Key functionalities include detection of institutional absorption (when large volume does not move price), breakout validation through volume and flow speed, reversal anticipation by exhaustion signals, and an intelligent streak system counting consecutive buy or sell ticks. The indicator also suggests lot sizing based on flow strength and institutional intensity, and applies an institutional filter distinguishing retail versus institutional flow.
Tape Reading 4.2 supports analysis of key market levels, real-time aggression, and flow reversals, transforming traditional charts into comprehensive institutional market reading tools. It is suitable for traders seeking detailed order flow insights and confirmation signals for entries based on market microstructure and volume dynamics.
Kundenbewertungen
5 | 50 % | |
4 | 50 % | |
3 | 0 % | |
2 | 0 % | |
1 | 0 % |


![„[Stellar Strategies] MARSI Signal Plotter“-Logo](https://cdn.ctrader.com/image/webp/7b2b8da6-8f8e-4646-8d4a-4710c516c01e_25567)


