
Beschreibung
CHoCH Breakout Block
https://chartshots.spotware.com/c/69960085a796e
Dieser Indikator ist für Trader konzipiert, die mit Price Action und Smart Money Concepts (SMC) Methoden arbeiten. Empfohlene Verwendung:
- 🔍 Identifizieren Sie den CHoCH als erstes Signal für eine mögliche strukturelle Umkehr.
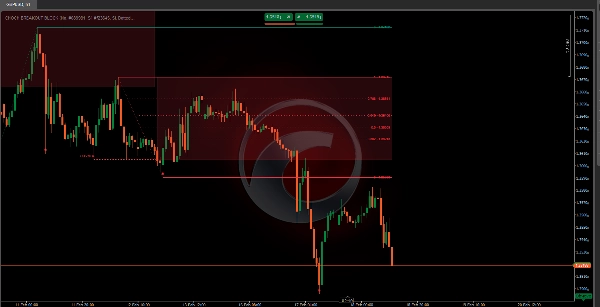
- 👀 Beobachten Sie die Interessezone die entsteht: Es ist der Bereich, in den der Preis normalerweise zurückkehrt, bevor er in die neue Richtung weitergeht.
- ⏳ Warten Sie, bis der Preis in die Zone zurückkehrt und suchen Sie darin nach Übereinstimmung mit Fibonacci-Niveaus (insbesondere 0.382, 0.5, 0.618 und 0.786).
- ✅ Bestätigen Sie mit einer Engulfing-Kerze (wenn im StructureBased-Modus) innerhalb der Zone für einen präziseren Einstieg.
- ❌ Der Trade ist ungültig wenn der Preis die gegenüberliegende Grenze der Zone verletzt, da der Indikator die Zone in diesem Moment selbst aufhebt.
https://chartshots.spotware.com/c/699600271b05d
📊 1. Drei-Ebenen-Strukturanalyse
Der Indikator analysiert den Markt über drei verschachtelte hierarchische Ebenen, von der geringsten bis zur bedeutendsten:
- 🔹 Kurzfristig: Erkennt die jüngsten lokalen Hochs und Tiefs durch den Vergleich von drei aufeinanderfolgenden Kerzen. Ein lokales Tief wird bestätigt, wenn die mittlere Kerze niedriger ist als sowohl die vorherige als auch die nächste. Ein lokales Hoch funktioniert umgekehrt.
- 🔸 Mittelfristig: Aufbauend auf den kurzfristigen Punkten. Wenn kurzfristige Schwünge ein Muster von tieferen Tiefs oder höheren Hochs bilden (was bedeutet, dass drei aufeinanderfolgende Schwünge eine Richtung bestätigen), wird ein mittelfristiger Punkt festgelegt.
- 🔺 Langfristig: Wird auf genau die gleiche Weise aufgebaut, verwendet jedoch mittelfristige Punkte als Basis. Dies ist die bedeutendste Ebene und diejenige, die die Hauptereignisse des Indikators auslöst.
💡 Diese kaskadierende Struktur stellt sicher, dass nur Bewegungen mit echtem strukturellem Gewicht Signale erzeugen, wodurch kurzfristiges Rauschen herausgefiltert wird.
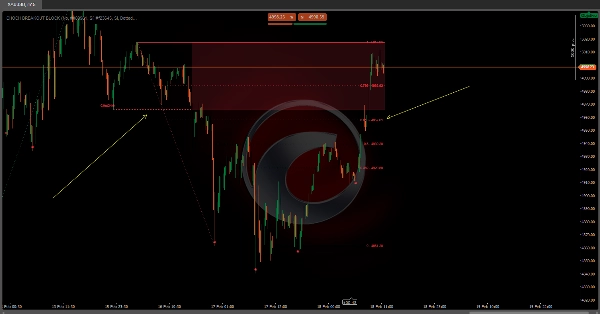
🔄 2. CHoCH — Change of Character
Der CHoCH ist das zentrale Ereignis des Indikators. Er tritt auf, wenn:
- 🟢 Bullischer CHoCH: Der Preis schließt über einem vorherigen langfristigen strukturellen Hoch, während die vorherige Marktrichtung bärisch war. Dies zeigt an, dass die Verkäufer die Kontrolle verloren haben und der Markt nach oben drehen könnte.
- 🔴 Bärischer CHoCH: Der Preis schließt unter einem vorherigen langfristigen strukturellen Tief, während die vorherige Richtung bullisch war. Dies zeigt an, dass die Käufer die Kontrolle verloren haben und der Markt nach unten drehen könnte.
Wenn ein CHoCH erkannt wird, zeichnet der Indikator:
- ➡️ Eine horizontale Linie auf dem genauen Ausbruchslevel (mit dem konfigurierten Stil und der Dicke)
- 🏷️ Das "CHoCH"-Label über dieser Linie
- 🟥🟩 Eine halbtransparente Interessezone
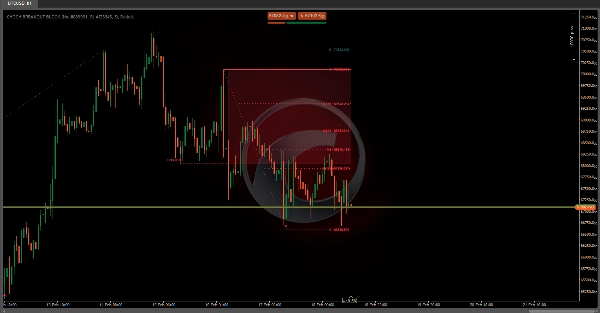
🗺️ 3. Interessezone
Unmittelbar nach einem CHoCH grenzt der Indikator automatisch eine Schlüsselpreiszone ab:
- 🟢 Bei einem bullischen CHoCH: Die Zone erstreckt sich vom Ausbruchslevel (CHoCH) bis zum tiefsten Punkt, der zwischen dem strukturellen Schwung und dem Ausbruch gefunden wurde. Diese Zone repräsentiert den Bereich, in den der Preis zurückkehren könnte, um Liquidität zu suchen bevor er nach oben weitergeht.
- 🔴 Bei einem bärischen CHoCH: Die Zone erstreckt sich vom höchsten Punkt, der zwischen dem Schwung und dem Ausbruch gefunden wurde, bis zum CHoCH-Level. Sie repräsentiert den Bereich, in den der Preis zurückkehren könnte, um Liquidität zu suchen bevor er nach unten weitergeht.
Die Zone erstreckt sich automatisch Balken für Balken solange der Preis ihre Grenzen respektiert. In dem Moment, in dem der Preis die gegenüberliegende Grenze verletzt, hört die Zone auf sich auszudehnen — was darauf hinweist, dass sie getestet oder ungültig geworden ist.
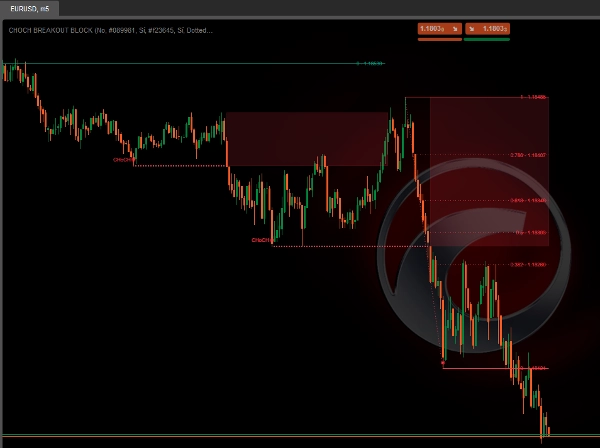
👁️ Wie im Chartbild zu sehen ist, repräsentieren die halbtransparenten roten Zonen diese bärischen Interessensbereiche nach den erkannten CHoCH-Ereignissen.
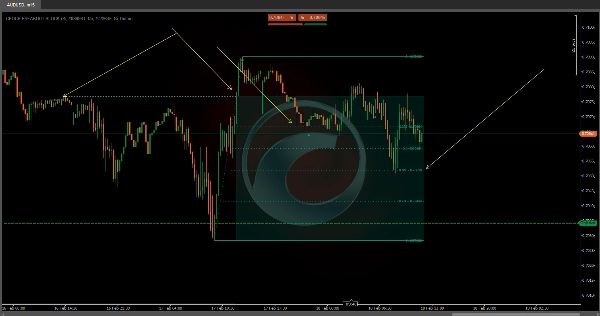
📐 4. Automatische Fibonacci-Niveaus
Nachdem ein CHoCH erkannt wurde, zeichnet der Indikator die Fibonacci nicht sofort. Die Fibonacci erscheint in einer zweiten Phase, wenn der Markt bestätigt, dass die neue Richtung echtes strukturelles Gewicht hat. Dies geschieht in zwei Schritten:
Schritt 1 — Der CHoCH tritt auf: 🏷️ Die Ausbruchslinie, das Label und die Interessezone werden gezeichnet. Die Fibonacci ist noch nicht sichtbar.
Schritt 2 — Der Markt bildet einen neuen langfristigen Schwung in Richtung des CHoCH: 📐 Erst in diesem Moment projiziert der Indikator automatisch die Fibonacci-Niveaus zwischen dem Ausbruch-Referenzpunkt und diesem neu bestätigten Schwung.
📌 Beispiel: Bei einem bullischen CHoCH wird die Fibonacci vom tiefsten Punkt während des Ausbruchs bis zum ersten langfristigen Hoch, das der Markt danach bildet, gezeichnet. Wenn der Preis steigt, aber diesen strukturellen Schwung noch nicht konsolidiert hat, werden die Fibonacci-Niveaus noch nicht sichtbar sein — dies ist beabsichtigt und kein Fehler.
Sobald aktiv, erstrecken sich die Niveaus Balken für Balken, solange die Struktur gültig bleibt, und werden automatisch neu berechnet wenn ein neuer struktureller Ausbruch erscheint. Die verfügbaren Niveaus sind:
Level
Übliche Bedeutung
0
Ursprung der Bewegung
Kleine Korrektur
⭐ Erste relevante Korrektur
0.5
⭐ Mittleres Niveau
⭐ Goldener Schnitt
Variante des Goldenen Schnitts
⭐ Tiefe Korrektur
1
100% Erweiterung
🕯️ 5. Erkennung von Engulfing-Kerzen
Der Indikator beinhaltet Erkennung von Engulfing-Kerzenmustern als zusätzliches Bestätigungssignal:
- ▲ Ein bullishes Engulfing erscheint, wenn eine große grüne Kerze eine vorherige kleine rote Kerze vollständig umschließt.
- ▼ Ein bärisches Engulfing erscheint, wenn eine große rote Kerze eine vorherige kleine grüne Kerze vollständig umschließt.
Es gibt zwei Anzeigemodi:
- 📋 Alle: Zeigt jedes Engulfing-Muster, das im Chart erscheint.
- 🎯 StructureBased: Zeigt nur Engulfing-Muster, die innerhalb einer aktiven Interessezone auftreten, was die Relevanz des Signals erheblich erhöht.
Zusammenfassung
When a CHoCH occurs, the indicator marks the breakout level with a horizontal line and label, and automatically creates a semi-transparent interest zone where price is likely to return before continuing in the new direction. This zone extends dynamically as long as price respects its boundaries and is invalidated if price breaks the opposite boundary.
The indicator also projects Fibonacci retracement levels automatically after the market confirms the new trend direction by forming a new long-term swing. Supported Fibonacci levels include 0.236, 0.382, 0.5, 0.618, 0.65, 0.786, and 1. Additionally, it detects bullish and bearish engulfing candle patterns as confluence signals, with options to display all patterns or only those occurring within active interest zones for higher precision.
This tool supports multiple markets including BTCUSD, EURUSD, GBPUSD, NZDUSD, XAUUSD, NAS100, and USDJPY.
Kundenbewertungen
5 | 100 % | |
4 | 0 % | |
3 | 0 % | |
2 | 0 % | |
1 | 0 % |


