
Beschreibung
Advanced Pro Volume Profile: Institutioneller fester Bereich & Order Flow
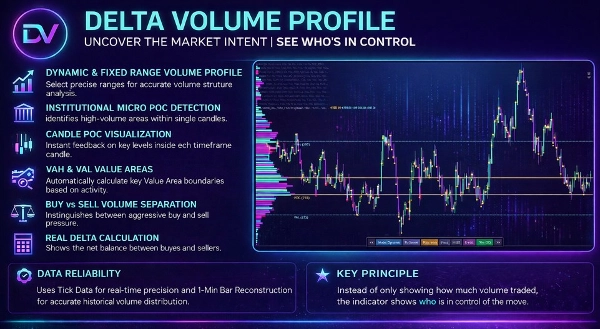
Verbessern Sie Ihre Marktanalyse mit dem Advanced Pro Volume Profile, einem hochoptimierten, institutionellen Indikator, der für Trader entwickelt wurde. Konzipiert für Daytrader, Scalper und Swing-Trader, die auf die Auktion-Markt-Theorie setzen, bringt dieses Tool Präzision in die Volumenverteilung, Wertbereiche und Order Flow Dynamiken.
Im Gegensatz zu standardmäßigen Retail-Volumenprofilen, die ständig neu berechnet, verschoben oder beim Rein- und Rauszoomen unterbrochen werden, führt dieser Indikator einen True Anchor Mode (Fester Bereich) mit Speicherfunktion ein, was ihn zum ultimativen Werkzeug für Live-Trading und gründliche historische Analysen macht.
🔥 Kernfunktionen & Trading-Vorteil
1. True Anchor Mode (Perfekt für Backtesting)
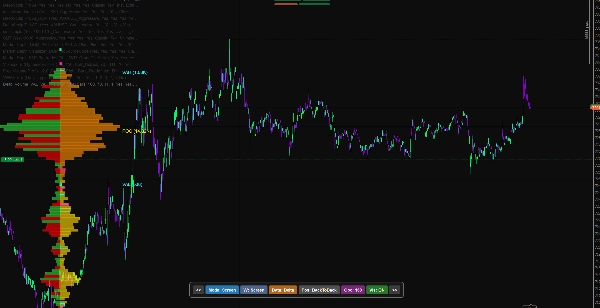
Hören Sie auf, mit verschiebenden Profilen zu kämpfen! Mit unserem Anchor Mode können Sie zwei interaktive vertikale Linien überall auf Ihrem Chart platzieren, um einen bestimmten Swing, eine Session oder eine Konsolidierungszone zu analysieren.
- Keine Verzerrung: Zoomen Sie rein, raus oder scrollen Sie – das Profil bleibt mathematisch an Ihren gewählten Ankerpunkten fixiert.
- Historisches Backtesting: Scrollen Sie Monate oder Jahre zurück, verankern Sie das Profil an einem vergangenen Marktereignis und analysieren Sie die exakte Volumenverteilung und den Point of Control (POC) so, wie es damals war. Die Anker merken sich ihre genauen Positionen, sodass Sie vergangene Setups fehlerfrei studieren können, ohne dass sich das Raster zurücksetzt.
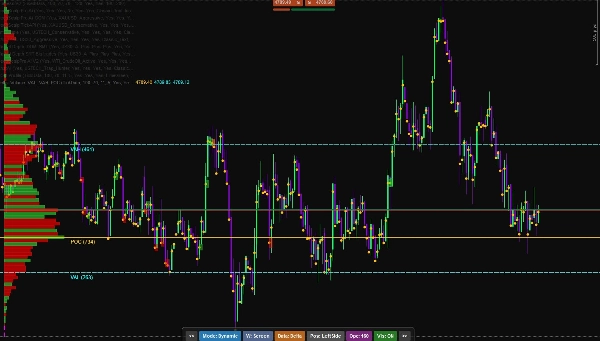
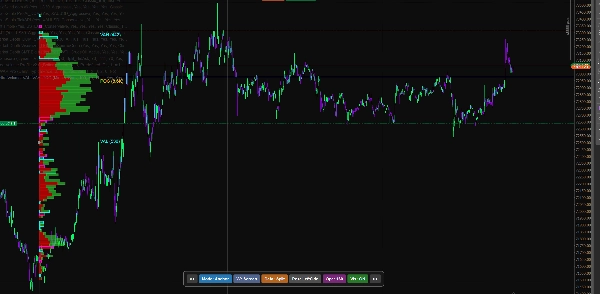
2. Interaktives UI-Panel im Chart
Sie müssen die Indikatoreinstellungen nicht ständig öffnen. Ein schlankes, unaufdringliches UI-Panel am unteren Rand Ihres Charts ermöglicht Ihnen:
- Umschalten zwischen Bildschirmmodus (dynamisch) und Ankermodus (fester Bereich) mit einem Klick.
- Verschieben der Profilposition (links, rechts, Rücken an Rücken).
- Anpassen der visuellen Breite und Opazität in Echtzeit.
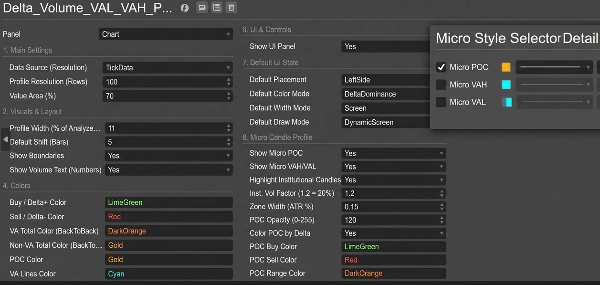
- Wechseln zwischen Kauf-/Verkauf-Aufteilung und Delta-Dominanz Volumenfärbung.
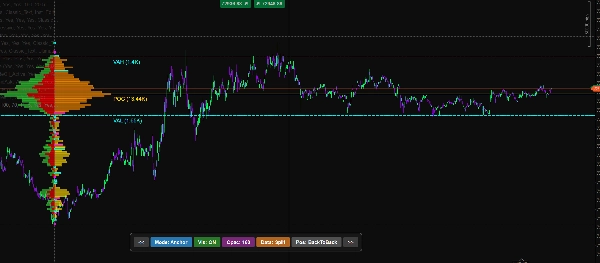
3. Tiefe Einblicke in den Order Flow
Lesen Sie die Mikrostruktur des Marktes wie ein Profi:
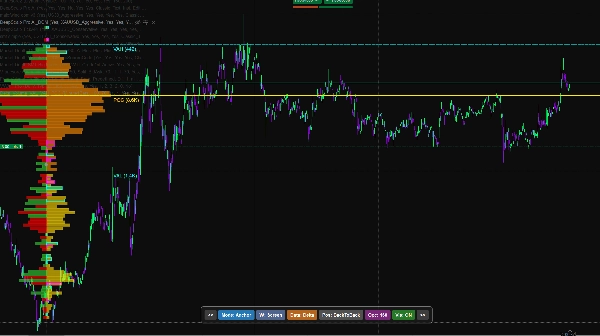
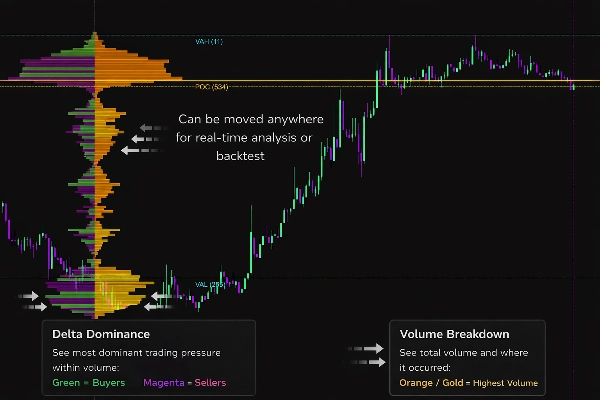
- Delta-Dominanz & Aufteilung: Visualisieren Sie aggressives Markt-Kaufen vs. Markt-Verkaufen innerhalb jeder Preiszone.
- Volumenungleichgewichte: Erkennen und heben Sie automatisch massive Kauf-/Verkaufsungleichgewichte hervor (anpassbares Verhältnis, z.B. 300% Dominanz), um institutionelle Absorption oder aggressive Ausbrüche zu erkennen.
- HVN- & LVN-Erkennung: Identifiziert klar High Volume Nodes (Preismagnete) und Low Volume Nodes (Liquiditätslücken, in denen sich der Preis schnell bewegt).
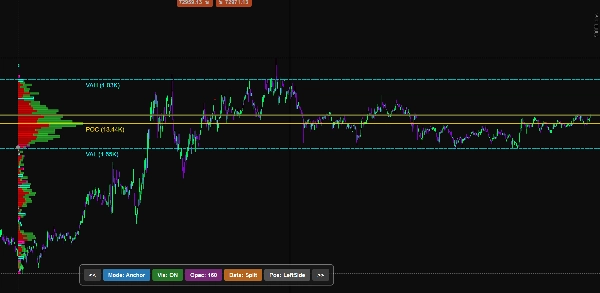
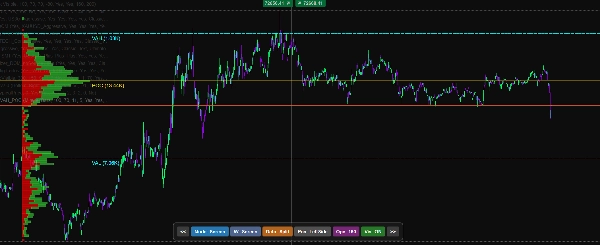
4. Dynamischer Wertbereich & Naked POC
- Zeigt präzise Value Area High (VAH) und Value Area Low (VAL) Linien basierend auf Standardabweichungen (Standard 70%).
- Hebt den Point of Control (POC) hervor.
- Naked POC erweitern: Verlängert automatisch ungeprüfte POC-Linien in die Zukunft und bietet Ihnen hochreaktive Unterstützungs- und Widerstandszonen.
5. Hochoptimiert
- Datenquellen: Wählen Sie zwischen hypergenauen Tick-Daten oder leichtgewichtigen 1-Minuten-Balken-Daten für langfristige historische Analysen.
- Intelligente Darstellung: Entwickelt, um massive Datenmengen zu verarbeiten, ohne Ihre Plattform zum Einfrieren zu bringen.
🛠️ Wie man es zum Lernen verwendet, wenn man nicht handelt:
- Scrollen Sie im Chart zu Ihrem gewünschten Datum zurück.
- Klicken Sie "Modus: Anker" im UI-Panel.
- Ziehen Sie die zwei vertikalen gestrichelten Linien, um den genauen Preisschwung oder die Handelssession einzuschließen, die Sie analysieren möchten.
- Das Volumenprofil wird sofort generiert. Sie können in das 1-Minuten-Chart zoomen, um die genauen Einstiegspunkte, Ungleichgewichte und Wertbereichs-Retests zu inspizieren, ohne dass das Profil seine Position verliert!
Übernehmen Sie die Kontrolle über Ihre Charts. Hören Sie auf, Retail-Muster zu handeln, und beginnen Sie, institutionelles Volumen zu handeln.
Zusammenfassung
An interactive on-chart UI panel enables quick toggling between dynamic Screen Mode and fixed Anchor Mode, profile position adjustments, visual customization, and switching between Buy/Sell Split and Delta Dominance volume coloring. The tool offers deep order flow insights, including visualization of aggressive buying versus selling, automatic detection of volume imbalances, and identification of High Volume Nodes (HVN) and Low Volume Nodes (LVN).
It displays dynamic Value Area High (VAH), Value Area Low (VAL), and Point of Control (POC) lines, with an option to extend naked POC lines as future support/resistance targets. Users can select data sources between tick data and 1-minute bars for optimized performance and historical analysis. The indicator is engineered for efficient rendering to handle large datasets without platform lag.
Kundenbewertungen
5 | 50 % | |
4 | 50 % | |
3 | 0 % | |
2 | 0 % | |
1 | 0 % |


