
Beschreibung
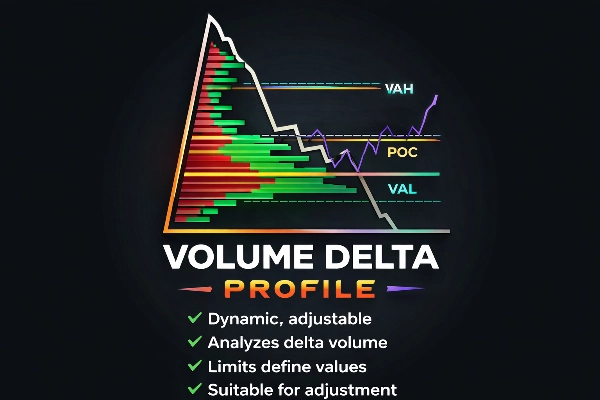
Volume Delta Profil
Professionelle Order Flow Einblicke für fortgeschrittene Trader
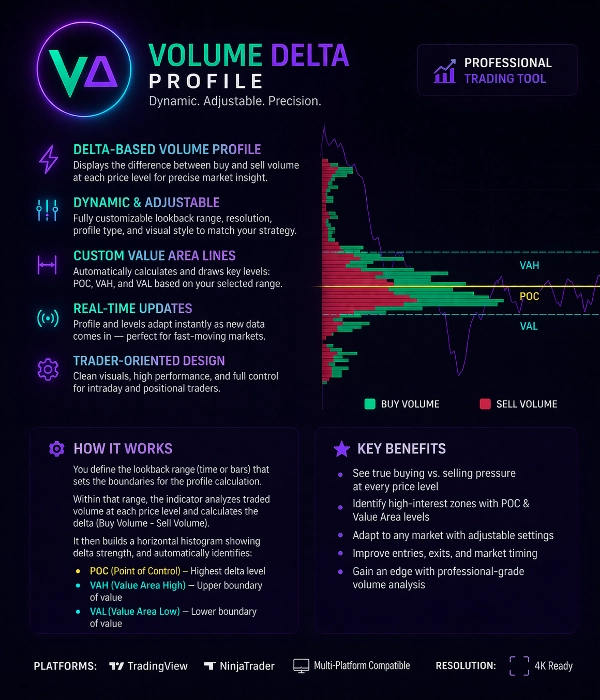
Volume Delta Profil ist ein leistungsstarkes Trading-Tool, das entwickelt wurde, um das wahre Gleichgewicht zwischen Käufern und Verkäufern auf jeder Preisstufe zu offenbaren.
Im Gegensatz zu traditionellen Volumenprofilen analysiert dieser Indikator Delta-Volumen (Kaufvolumen – Verkaufsvolumen), um zu zeigen, wo aggressive Marktteilnehmer dominieren.
Er hilft Tradern dabei, institutionelle Aktivitäten, Absorptionszonen und preislich interessante Bereiche präzise zu identifizieren.
Kernfunktionen
Delta-basiertes Volumenprofil
Der Indikator berechnet Volumen-Delta auf jeder Preisstufe und trennt:
• Aggressiven Kaufdruck
• Aggressiven Verkaufsdruck
Dies zeigt auf, wer tatsächlich den Markt kontrolliert.
Dynamischer & anpassbarer Profilbereich
Der Bereich der Profilberechnung ist vollständig anpassbar.
Benutzer können den Berechnungsbereich definieren durch:
• Benutzerdefinierte Balkenreichweite
• Sitzungsbereich
• Manuelle Auswahl
• Rollender dynamischer Bereich
Das Profil aktualisiert sich automatisch, wenn neue Daten eintreffen.
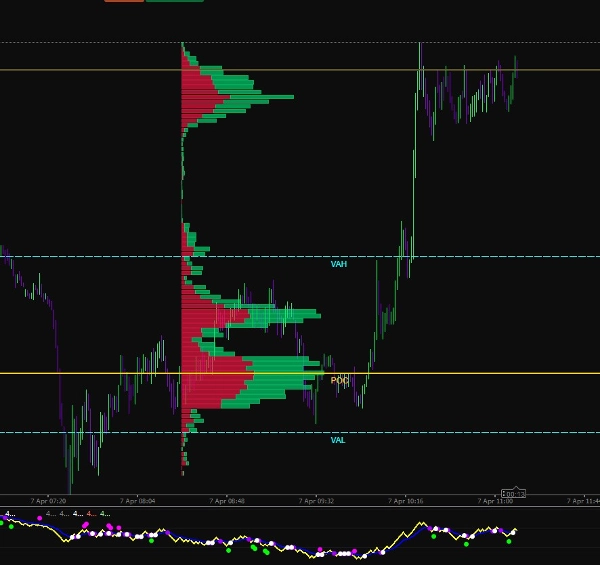
Erkennung des Wertbereichs
Der Indikator berechnet automatisch wichtige Marktstruktur-Level:
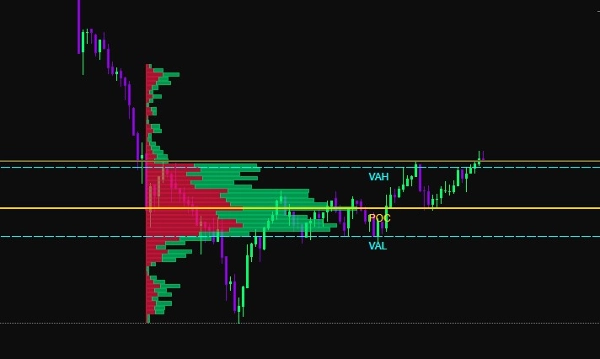
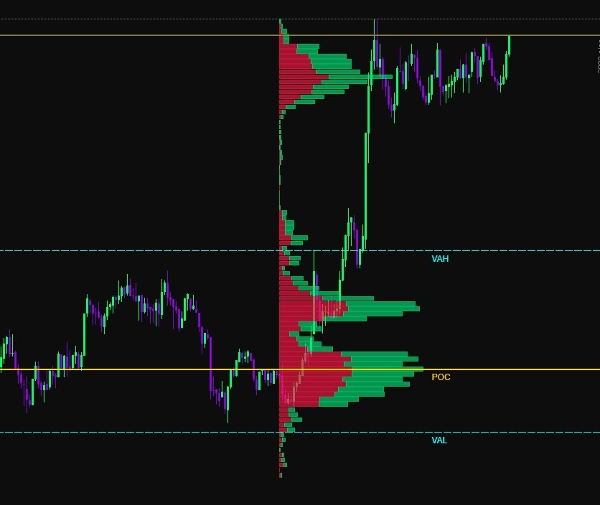
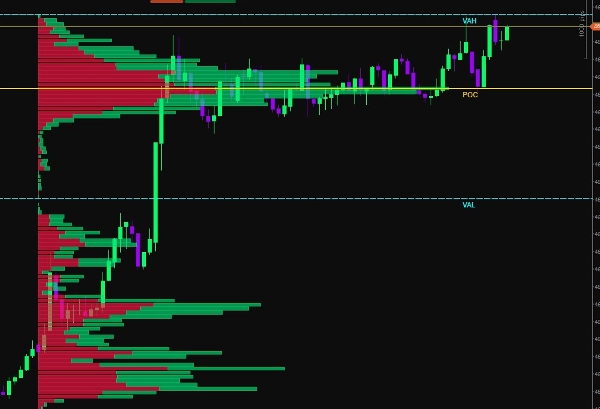
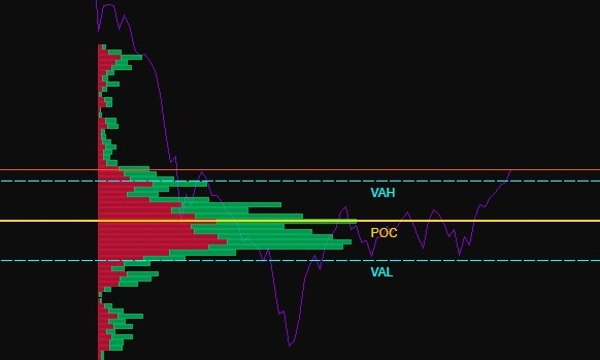
POC (Point of Control)
Die Preisstufe mit dem höchsten gehandelten Delta-Volumen.
VAH (Value Area High)
Obere Grenze des Wertbereichs.
VAL (Value Area Low)
Untere Grenze des Wertbereichs.
Diese Level heben hervor, wo die Mehrheit der Marktaktivität stattfand.
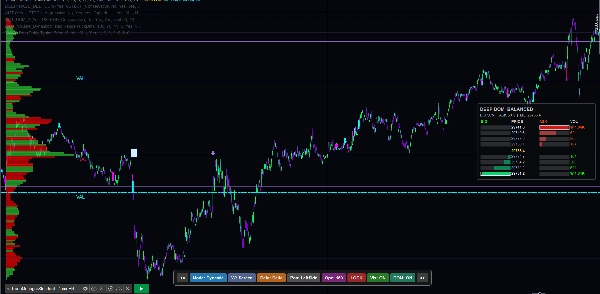
Visualisierung von Kauf vs Verkauf
Volumen wird als horizontaler Histogramm dargestellt:
Grüne Balken → Dominantes Kaufvolumen
Rote Balken → Dominantes Verkaufsvolumen
Dies ermöglicht es Tradern, sofort zu erkennen:
• Absorptionszonen
• Ungleichgewichtsbereiche
• Liquiditätscluster
• Institutionelle Fußabdrücke
Adaptive Visualisierung
Der Indikator bietet mehrere visuelle Anpassungsoptionen:
• Einstellbare Histogrammbreite
• Benutzerdefinierte Farbschemata
• Einstellbare Transparenz
• Auflösungssteuerung
• Zoom-adaptive Darstellung
Dies gewährleistet eine klare Visualisierung auf allen Chart-Zeitrahmen.
Intelligente Grenzwerte
Der Indikator zeichnet dynamische Referenzlevel:
• POC-Linie
• VAH-Linie
• VAL-Linie
Diese Level aktualisieren sich automatisch basierend auf dem ausgewählten Profilbereich und können verwendet werden als:
• Unterstützung / Widerstand
• Zonen der Mittelwertumkehr
• Breakout-Bestätigungslevel
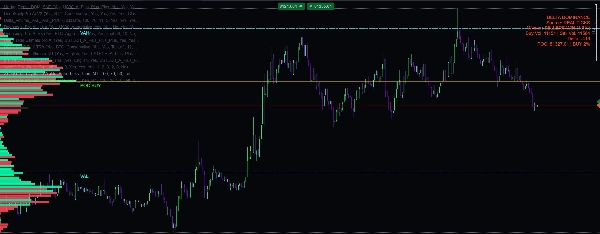
Echtzeit-Berechnung
Volume Delta Profil berechnet kontinuierlich mit Live-Marktdaten neu.
Dies stellt sicher, dass Trader stets aktuelle Order Flow Informationen während schneller Märkte sehen.
Anwendungsfälle
Dieses Tool ist ideal für:
• Scalping
• Intraday-Handel
• Futures-Handel
• Order Flow Analyse
• Liquiditätsverfolgung
• Erkennung institutioneller Fußabdrücke
Wichtige Trading-Vorteile
✔ Echtes Kauf- vs. Verkaufsdruck erkennen
✔ Absorptions- und Erschöpfungszonen erkennen
✔ Hohe Liquiditätslevel lokalisieren
✔ Einstiegssicherheit verbessern
✔ Breakouts oder Umkehrungen bestätigen
✔ Marktstruktur verstehen
Technische Spezifikationen
Berechnungsmethode:
Delta Volumen = Kaufvolumen − Verkaufsvolumen
Profiltyp:
Horizontales Preisstufen-Histogramm
Automatische Level:
POC, VAH, VAL
Aktualisierungsmodus:
Echtzeit-Dynamische Aktualisierung
Benutzereinstellungen:
• Profilbereich
• Histogrammauflösung
• Volumenskalierung
• Farbeinstellungen
• Sichtbarkeit der Level
Plattformkompatibilität:
Optimiert für leistungsstarke Chart-Darstellung
Entwickelt für professionelle Trader
Volume Delta Profil ist für Trader entwickelt, die über einfache Indikatoren hinausgehen und die wirklichen Mechanismen des Marktes verstehen möchten.
Durch die Kombination von Volumenanalyse, Delta-Berechnung und Wertbereichsstruktur bietet dieses Tool eine klare Sicht auf Marktteilnahme und Liquiditätsverteilung.
Zusammenfassung
Users can customize the profile calculation range using options such as custom bar range, session range, manual selection, or rolling dynamic range, with real-time updates as new market data arrives. Key market structure levels—Point of Control (POC), Value Area High (VAH), and Value Area Low (VAL)—are automatically calculated and drawn as dynamic reference lines, useful for support/resistance, mean reversion, and breakout confirmation.
Additional features include adjustable histogram width, color schemes, transparency, resolution control, and zoom-adaptive rendering for clear visualization across all chart timeframes. The tool supports use cases like scalping, intraday trading, futures trading, order flow analysis, liquidity tracking, and institutional footprint detection. It is optimized for high-performance chart rendering and aims to provide traders with precise insights into market participation and liquidity distribution.


