
Beschreibung
Hull Moving Average Colored – Trendrichtung auf einen Blick
Überblick
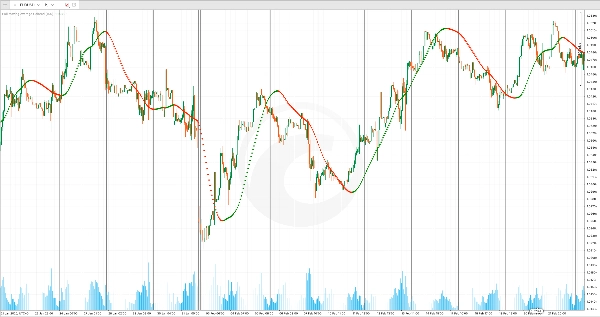
Hull Moving Average Colored ist ein schlanker Trendfolgeindikator, der die Reaktionsfähigkeit des Hull Moving Average mit farbcodierten Richtungsanzeigen kombiniert. Durch die Darstellung von Aufwärtstrends in Grün und Abwärtstrends in Rot bietet er eine sofortige visuelle Bestätigung der Momentumrichtung, ohne dass eine komplexe Analyse erforderlich ist.
Was er bewirkt
Grundlage des Hull Moving Average: Der Indikator verwendet den Hull Moving Average (HMA), einen schnell reagierenden gleitenden Durchschnitt, der darauf ausgelegt ist, Verzögerungen zu reduzieren und gleichzeitig eine glatte Darstellung zu gewährleisten. Im Gegensatz zu traditionellen gleitenden Durchschnitten priorisiert der HMA die jüngsten Kursbewegungen, was ihn besonders nützlich macht, um Trendwechsel frühzeitig zu erkennen.
Farbcodierte Trendvisualisierung: Anstelle einer einzigen Linie zeichnet der Indikator Richtungs-Punkte:
- Grüne Punkte: Erscheinen, wenn der HMA steigt und nach oben gerichtetes Momentum anzeigt
- Rote Punkte: Erscheinen, wenn der HMA fällt und nach unten gerichtetes Momentum anzeigt
Dieses binäre Farbsystem macht die Trendrichtung auf einen Blick eindeutig – es ist keine Interpretation der Steigung oder ein Vergleich mit vorherigen Balken erforderlich.
Hauptmerkmale
Overlay-Anzeige: Der Indikator wird direkt auf Ihrem Kurschart dargestellt, sodass Sie die Trendrichtung in Bezug auf die tatsächlichen Kursniveaus sehen können. Dies erleichtert das Erkennen, wenn der Kurs über oder unter den gleitenden Durchschnitt bricht, was potenzielle Ein- und Ausstiegspunkte signalisiert.
Reaktionsschnelle Verzögerungsreduktion: Der Hull Moving Average reagiert schneller als Standard-Exponentielle oder einfache gleitende Durchschnitte, was ihn besonders effektiv für Swing-Trader und Intraday-Trader macht, die zeitnahe Signale ohne übermäßige Fehlsignale benötigen.
Einfache Anpassung: Passen Sie den Periodenparameter an, um die Empfindlichkeit zu steuern. Kürzere Perioden (z. B. 20-32) machen den Indikator reaktionsschneller auf jüngste Bewegungen, sind jedoch anfälliger für Fehlsignale in unruhigen Märkten. Längere Perioden (z. B. 64-128) liefern glattere Trends mit weniger falschen Ausbrüchen, können jedoch schnelle Umkehrungen verpassen.
Praktische Anwendung
Verwenden Sie Hull Moving Average Colored als schnellen Filter für die Handelsrichtung. Gehen Sie nur Long-Positionen ein, wenn grüne Punkte erscheinen und der Kurs über dem Durchschnitt liegt; gehen Sie nur Short-Positionen ein, wenn rote Punkte erscheinen und der Kurs unter dem Durchschnitt liegt. Behandeln Sie Farbwechsel hingegen als potenzielle Ausstiegssignale – wenn Grün zu Rot wechselt, ist es Zeit, Ihre Long-Positionen neu zu bewerten.
Der Indikator funktioniert gut in Trendmärkten und ist besonders nützlich auf höheren Zeitrahmen (4-Stunden und täglich), wo er Ihnen helfen kann, sich vor dem Handel mit Setups auf niedrigeren Zeitrahmen mit der übergeordneten Richtungsneigung abzustimmen.
Zusammenfassung
This indicator overlays directly on price charts and uses a binary color system to indicate trend direction: green points appear when the HMA is rising, signaling upward momentum, and red points appear when the HMA is falling, signaling downward momentum. This visual approach allows traders to quickly identify trend direction without interpreting slopes or comparing previous bars.
Users can adjust the period parameter to control sensitivity—shorter periods increase responsiveness but may generate more false signals, while longer periods smooth trends but may delay signals. The indicator is suitable for various markets including Forex, indices, stocks, and cryptocurrencies such as BTCUSD and XAUUSD. It is particularly useful on higher timeframes (4-hour and daily) for aligning with broader market trends and can assist in identifying potential entry and exit points based on trend changes.
Kundenbewertungen
5 | 0 % | |
4 | 100 % | |
3 | 0 % | |
2 | 0 % | |
1 | 0 % |


