present
Registrieren Sie sich und erhalten Sie $50 Rabatt auf Ihren ersten Kauf
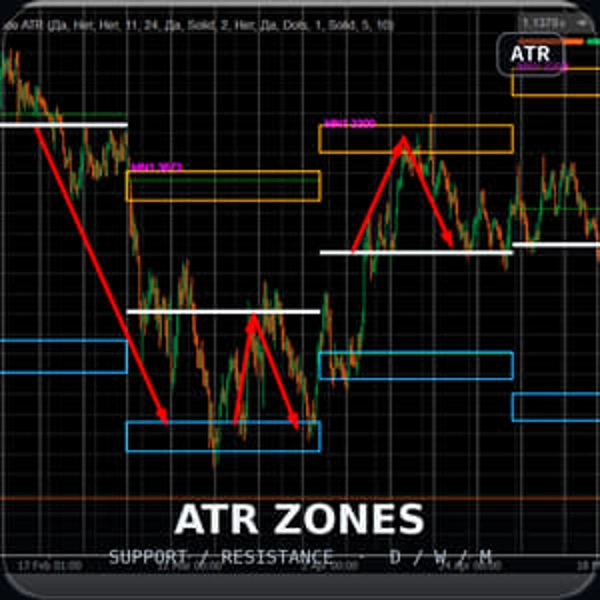
Trading product for MyZtrade W1 MN zones Indikator EMA Supertrend, image 1
MyZtrade W1 MN zones
Indikator
Version 1.0, Aug 2026
Windows, Mac
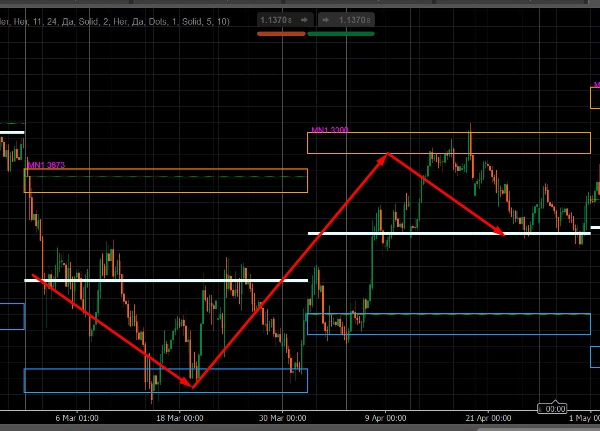
Trading product for MyZtrade W1 MN zones Indikator EMA Supertrend, image 2
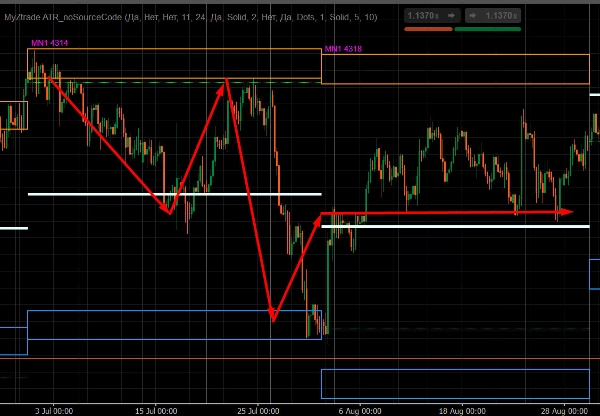
Trading product for MyZtrade W1 MN zones Indikator EMA Supertrend, image 3
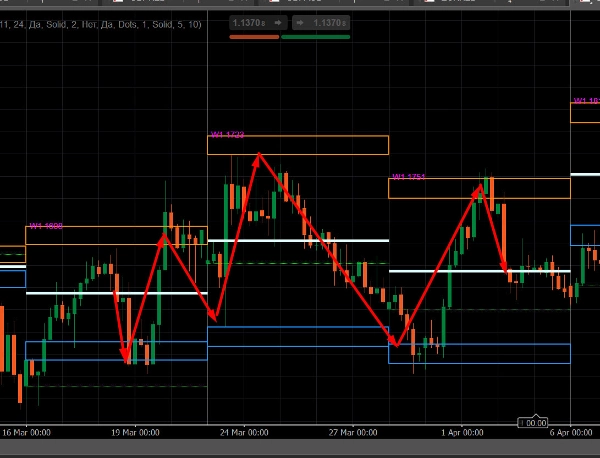
Trading product for MyZtrade W1 MN zones Indikator EMA Supertrend, image 4
Trading product for MyZtrade W1 MN zones Indikator EMA Supertrend, image 5
Seit 28/06/2025

Beschreibung

MyZtrade MTF ATR Zonen — Mehrzeitrahmen ATR-basierte Unterstützungs- & Widerstandszonen

Dieser Indikator zeichnet potenzielle Umkehrzonen (Unterstützung/Widerstand) im Chart basierend auf der durchschnittlichen High–Low-Spanne höherer Zeitrahmenbalken — Monatlich, Wöchentlich und Täglich — unabhängig vom eigenen Zeitrahmen des Charts.


Was er tut


Für jeden aktivierten Zeitrahmen (Monatlich / Wöchentlich / Täglich) :


• Berechnet die durchschnittliche Spanne (High–Low) über eine festgelegte Anzahl der jüngsten Balken in diesem Zeitrahmen (Standard: 11 Balken)


• Zeichnet rechteckige Widerstands- und Unterstützungszonen im Chart, versetzt vom Hoch/Tief jedes Balkens um den Wert dieser durchschnittlichen Spanne


• Beschriftet jede Zone mit dem Volatilitätswert in Punkten und dem Zeitrahmen-Präfix (zum Beispiel MN1 2696, W1 1180, D1 340) — nützlich, wenn mehrere Zeitrahmen gleichzeitig aktiviert sind


• Zeichnet zusätzlich die Eröffnungspreislinie des Balkens und die Medianlinie innerhalb der Zone


• Verfolgt separat den aktuellen (noch nicht geschlossenen) Balken — dessen Zone bewegt sich in Echtzeit, während sich der Balken entwickelt


Hauptmerkmale


• Mehrere Zeitrahmen gleichzeitig — Monatlich, Wöchentlich und Täglich können unabhängig voneinander aktiviert werden


• Nicht an den Zeitrahmen des Charts gebunden — Sie können monatliche Zonen in einem Stundenchart anzeigen usw.


• Vollständig anpassbares Erscheinungsbild — Farben, Linienstärke und -stil, Zonenausfüllung/-umriss, Textgröße


• Dient als visuelle Orientierungshilfe; erzeugt keine Handelssignale und enthält keine Ein- oder Ausstiegslogik

Zusammenfassung

KI-Zusammenfassung
MyZtrade W1 MN zones is a multi-timeframe indicator that identifies potential reversal zones of support and resistance on trading charts. It calculates the average range (High–Low) over a configurable number of recent bars (default 11) for selected higher timeframes—Monthly, Weekly, and Daily—regardless of the chart’s current timeframe. The indicator then plots rectangular zones offset from each bar’s high and low by this average range, visually marking areas where price reversals may occur.

Each zone is labeled with its volatility value in points and the corresponding timeframe prefix (e.g., MN1, W1, D1) to distinguish multiple enabled timeframes. Additional visual elements include the bar’s opening price line and a median line within each zone. The indicator also tracks the current, developing bar in real time, updating its zone dynamically.

Key features include simultaneous display of multiple timeframes, full customization of visual appearance (colors, line styles, text size), and independence from the chart’s timeframe, allowing monthly zones to be viewed on intraday charts. This tool serves as a visual guide for support and resistance levels based on volatility but does not provide trading signals or entry/exit logic.
Indikatorprofil

Kundenbewertungen

0.0
Bewertungen: 0
Kundenbewertungen
Bisher gibt es keine Bewertungen für dieses Produkt. Haben Sie es schon ausprobiert? Dann können Sie die erste Person sein, die andere darüber informiert!

Diskussion

Häufig gestellte Fragen (FAQ)

EMA
Supertrend
Supply & Demand
ATR
Moving Average
VWAP
Support & Resistance
Über den cTrader Store verfügbare Produkte, einschließlich Handelsbots, Indikatoren und Plugins, werden von externen Entwicklern bereitgestellt und nur zu Informations- und technischen Zugriffszwecken verfügbar gemacht. cTrader Store ist kein Broker und erbringt keine Anlageberatung, persönlichen Empfehlungen oder eine Garantie für zukünftige Performance.

Mehr von diesem Autor

Indikator
Volume
Key Levels
+4
Margin Zones its CME-based support/resistance levels from price extremes, helps traders spot entries and exits NKZ zones
Indikator
Channel
Fibonacci
+5
Market maker levels from key price extremes — catch major reversals and corrections in one click. ver1.2
Indikator
BOS
CHOCH
+5
MyZTrade High TF candle is a multi-timeframe visualisation tool that overlays completed higher-timeframe candles.

Das könnte Sie auch noch interessieren

Indikator
Advanced price action tool that combines multiple technical analysis concepts
„KANDIKA HEAT MAP“-Logo
Beste Ratings
4.6
(5)
$19
Indikator
Color-Based Market Pressure & Volatility Visualizer The Kandika Heatmap Indicator
Indikator
AI
ATR
+25
On-chart draggable panel to show/hide Positions & Pending Orders with fixed warning banner and inline alerts per symbol.
Indikator
Forex
EURUSD
+7
Institutional Session Levels Pro OHLC,Prev(D,W,M OHLC)
Indikator
Key Levels
Support & Resistance
Clean psychological round-number grid with native pip and point auto-scaling across Forex, Gold, Indices, and Crypto.
Indikator
Volume
Channel
+5
Spots volatility squeezes before they fire — the compression phase everyone else misses.
Indikator
ATR
Volume
+4
This allows traders to see not just the trend, but whether the momentum itself is overextended.
Indikator
Prop
Scalping
Shows bars from different Time Frame on zoom out and hides the current bars. Perfect tool for Multi TF "Market Reply"
Indikator
ZigZag
Indices
+2
Auto Trendlines, Fibonacci, Pitchfork and Patterns from non‑repainting pivots. One‑click Presets, targeted Alerts, and a
Indikator
Boost your trading with Candlestick Patterns for cTrader – auto-detect key signals for smarter, faster decisions!
Indikator
ATR
Channel
Reversal Trap Probability Bands plots a dynamic volatility envelope around price & automatically detects "trap" reversal
Indikator
This indicator is a valuable tool for traders looking to identify significant opening price level of any asset.
Indikator
EMA
A visual signal backtester that simulates trades directly on your chart and scores strategy performance.
Indikator
XAUUSD
Commodities
A Fair Value Gap (FVG) indicator that identifies potential price imbalances, potential reversal and continuation zones
Indikator
ATR
Volume
+5
Order blocks with measured hold-rate stats and confidence scoring — not just zones on a chart.
Indikator
Key Levels
Support & Resistance
Draws a colored High/Low/Open/Close box for any custom time range you set — trade breakouts & retests.
Indikator
Forex
cTrader Auto Support & Resistance detects key levels with Fibonacci analysis and sends real-time trading alerts.
Indikator
ATR
Forex
+5
A powerful ATR-based indicator generating clear BUY/SELL signals. Features real-time alerts and customizable sensitivity

Preis

Seit 28/06/2025