
MACD Crossover PRO
Indikator
3 käufe
Version 1.0, Oct 2025
Windows, Mac
5.0
Bewertungen: 1
Beschreibung
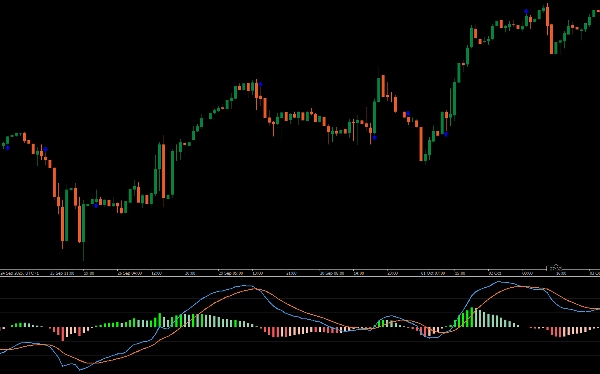
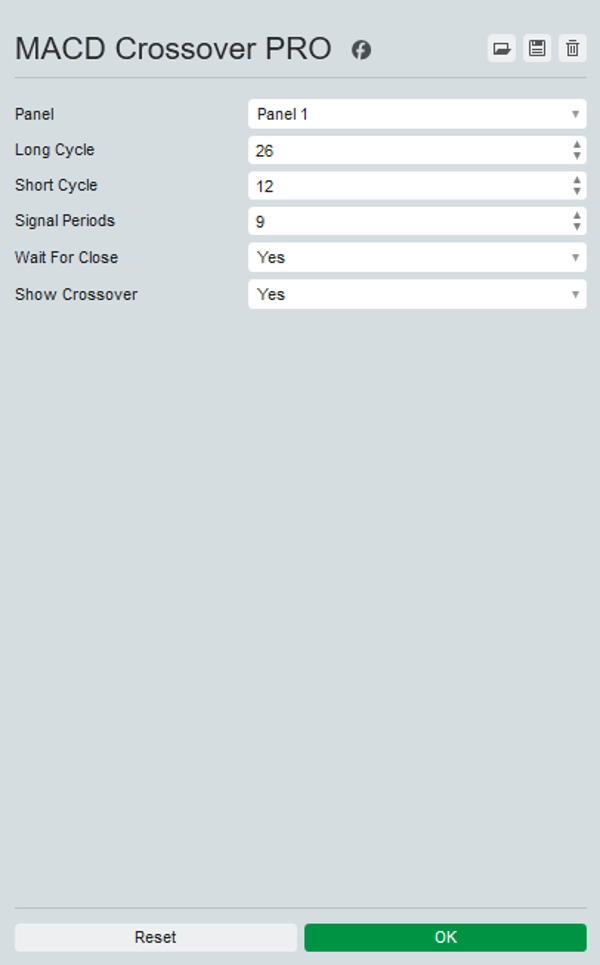
Einführung des anpassbaren klassischen MACD Indikators, der entwickelt wurde, um Ihr Handelserlebnis mit personalisierten Funktionen zu verbessern.
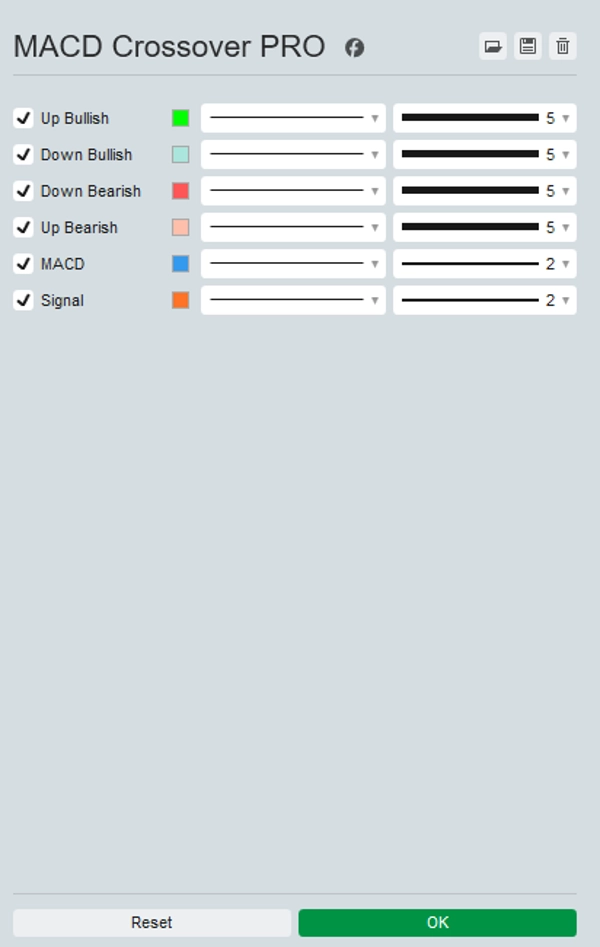
Diese verbesserte Version des traditionellen MACD ermöglicht es Ihnen, die Farben der Linien und des Histogramms für eine klarere Chartvisualisierung anzupassen. Optional kann er in Echtzeit mit Tick-Daten anstelle des Kerzenschlusses aktualisiert werden, um zeitnahe Einblicke in schnelllebigen Märkten zu bieten.
Zusätzlich hebt er Kreuzungspunkte direkt im Chart hervor, was das Erkennen potenzieller Kauf- und Verkaufssignale erleichtert.
Verbessern Sie Ihre Handelsstrategie mit dem anpassbaren klassischen MACD Indikator für verbesserte Genauigkeit und Entscheidungsfindung.
Zusammenfassung
KI-Zusammenfassung
MACD Crossover PRO is a customizable version of the classic MACD (Moving Average Convergence Divergence) indicator designed for enhanced trading analysis. It allows users to personalize the colors of the MACD lines and histogram for improved chart clarity. The indicator supports real-time updates based on tick data rather than waiting for candle closes, providing more immediate insights in fast-moving markets. It also visually highlights crossover points on the chart, aiding in the identification of potential buy and sell signals. This tool is applicable across various markets including Forex, cryptocurrencies, stocks, commodities, and indices, supporting symbols such as BTCUSD, EURUSD, GBPUSD, XAUUSD, NAS100, and USDJPY. The indicator is suited for traders employing strategies like scalping and signal-based entries, aiming to improve precision and decision-making through enhanced visualization and timely data updates.
Indikatorprofil
Kundenbewertungen
5.0
Bewertungen: 1
5 | 100 % | |
4 | 0 % | |
3 | 0 % | |
2 | 0 % | |
1 | 0 % |
Kundenbewertungen
October 15, 2025
The first test should keep DD under 3 percent. The review process gets less scattered.
Diskussion
Häufig gestellte Fragen (FAQ)
BTCUSD
Forex
Signal
Indices
EURUSD
Commodities
GBPUSD
NZDUSD
Prop
Scalping
Crypto
Stocks
XAUUSD
NAS100
MACD
USDJPY
Über den cTrader Store verfügbare Produkte, einschließlich Handelsbots, Indikatoren und Plugins, werden von externen Entwicklern bereitgestellt und nur zu Informations- und technischen Zugriffszwecken verfügbar gemacht. cTrader Store ist kein Broker und erbringt keine Anlageberatung, persönlichen Empfehlungen oder eine Garantie für zukünftige Performance.


![„[Hamster-Coder] Pivot Points MTF“-Logo](https://cdn.ctrader.com/image/webp/4c143e5a-309c-40e3-a578-f04d1e133ffa_31159)


Preis
Seit 25/09/2025
25
Verkäufe
316
Kostenlose Installationen