
Consolidation Zones
Indicador
1 compras
Versión 1.0, Oct 2025
Windows, Mac
4.0
Valoraciones: 1
Descripción
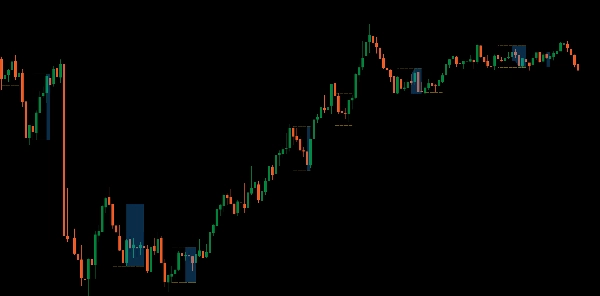
Presentamos el indicador Zonas de Consolidación, diseñado para ayudarte a identificar y aprovechar las oportunidades de ruptura con facilidad.
Esta poderosa herramienta resalta zonas en tu gráfico donde el precio se está consolidando, facilitando la identificación de posibles puntos de ruptura. Al visualizar estas áreas críticas, puedes anticipar mejor los movimientos del mercado y tomar decisiones de trading más informadas.
Ideal para traders que buscan mejorar su estrategia con información clara y accionable, mejora tu conjunto de herramientas de trading y domina las rupturas con el indicador Zonas de Consolidación.
Resumen
Resumen de IA
The Consolidation Zones indicator identifies and visualizes price consolidation areas on trading charts to help traders spot potential breakout points. By highlighting these zones, it assists in anticipating market movements and supports more informed decision-making. This tool is applicable across multiple markets, including Forex, cryptocurrencies (e.g., BTCUSD), commodities (e.g., gold, oil), indices (e.g., NAS100, SP500), and stocks. It is designed to enhance trading strategies focused on breakout opportunities by providing clear visual cues of consolidation phases.
Perfil del indicador
Valoraciones de clientes
4.0
Valoraciones: 1
5 | 0 % | |
4 | 100 % | |
3 | 0 % | |
2 | 0 % | |
1 | 0 % |
Valoraciones de clientes
October 12, 2025
Two timeframes give more context, and the log becomes easier to read.
Conversación
Preguntas frecuentes
BTCUSD
Forex
Breakout
Indices
EURUSD
Commodities
GBPUSD
NZDUSD
Prop
Crypto
Stocks
XAUUSD
NAS100
USDJPY
Los productos disponibles a través de cTrader Store, incluidos bots, indicadores y plugins para operar, son proporcionados por desarrolladores de terceros y están disponibles únicamente con fines informativos y de acceso técnico. cTrader Store no es un bróker, por lo que no proporciona asesoramiento de inversión, recomendaciones personales ni ninguna garantía de rentabilidad futura.


![Logotipo de "Gaussian Channel [Iridio Capital]"](https://cdn.ctrader.com/image/webp/7c039209-5573-4a54-a072-f9528b503103_41960)


![Logotipo de "[Stellar Strategies] MARSI Signal Plotter"](https://cdn.ctrader.com/image/webp/7b2b8da6-8f8e-4646-8d4a-4710c516c01e_25567)

Precio
Desde 25/09/2025
25
Ventas
315
Instalaciones gratis