
MACD Crossover PRO
Indicador
3 compras
Versión 1.0, Oct 2025
Windows, Mac
5.0
Valoraciones: 1
Descripción
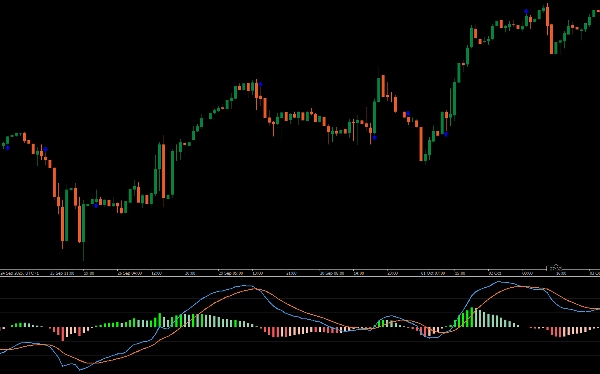
Presentamos el clásico MACD personalizable, diseñado para mejorar tu experiencia de trading con funciones personalizadas.
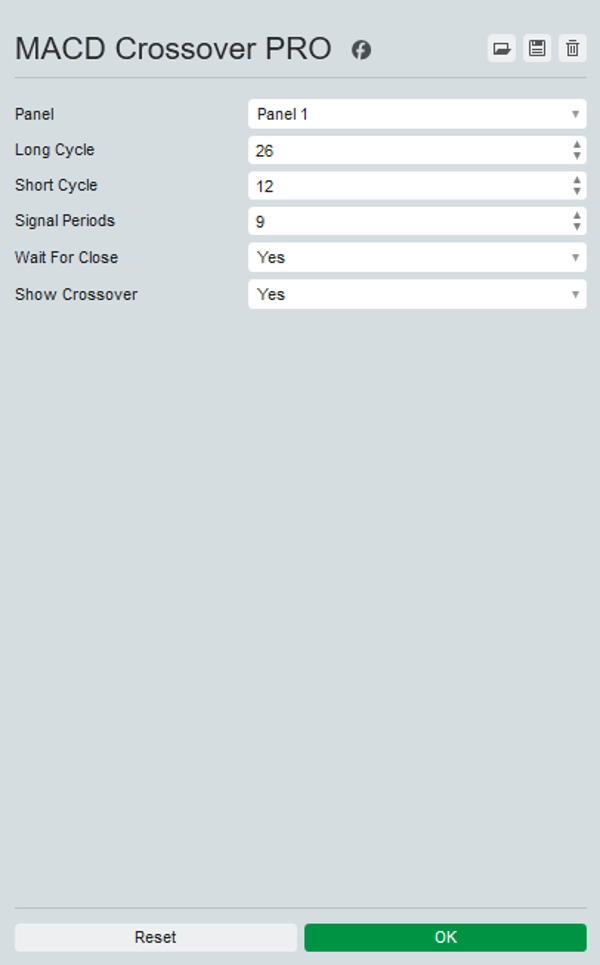
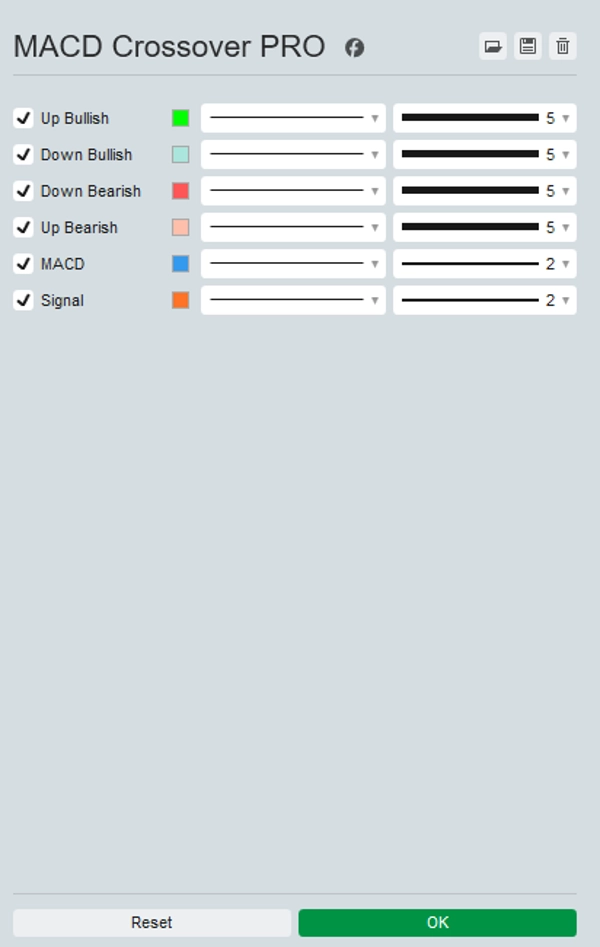
Esta versión mejorada del tradicional MACD te permite personalizar los colores de las líneas y el histograma para una visualización más clara del gráfico. Opcionalmente, puede actualizarse en tiempo real usando datos de ticks en lugar del cierre de la vela, proporcionando información oportuna en mercados de alta velocidad.
Además, resalta los puntos de cruce directamente en el gráfico, facilitando la identificación de posibles señales de compra y venta.
Mejora tu estrategia de trading con el clásico MACD personalizable para una mayor precisión y toma de decisiones.
Resumen
Resumen de IA
MACD Crossover PRO is a customizable version of the classic MACD (Moving Average Convergence Divergence) indicator designed for enhanced trading analysis. It allows users to personalize the colors of the MACD lines and histogram for improved chart clarity. The indicator supports real-time updates based on tick data rather than waiting for candle closes, providing more immediate insights in fast-moving markets. It also visually highlights crossover points on the chart, aiding in the identification of potential buy and sell signals. This tool is applicable across various markets including Forex, cryptocurrencies, stocks, commodities, and indices, supporting symbols such as BTCUSD, EURUSD, GBPUSD, XAUUSD, NAS100, and USDJPY. The indicator is suited for traders employing strategies like scalping and signal-based entries, aiming to improve precision and decision-making through enhanced visualization and timely data updates.
Perfil del indicador
Valoraciones de clientes
5.0
Valoraciones: 1
5 | 100 % | |
4 | 0 % | |
3 | 0 % | |
2 | 0 % | |
1 | 0 % |
Valoraciones de clientes
October 15, 2025
The first test should keep DD under 3 percent. The review process gets less scattered.
Conversación
Preguntas frecuentes
BTCUSD
Forex
Signal
Indices
EURUSD
Commodities
GBPUSD
NZDUSD
Prop
Scalping
Crypto
Stocks
XAUUSD
NAS100
MACD
USDJPY
Los productos disponibles a través de cTrader Store, incluidos bots, indicadores y plugins para operar, son proporcionados por desarrolladores de terceros y están disponibles únicamente con fines informativos y de acceso técnico. cTrader Store no es un bróker, por lo que no proporciona asesoramiento de inversión, recomendaciones personales ni ninguna garantía de rentabilidad futura.


![Logotipo de "High-Low Divergence [Iridio Capital]"](https://cdn.ctrader.com/image/webp/443c4661-7abb-40f1-842f-4b6ec560649b_40914)


Precio
Desde 25/09/2025
25
Ventas
315
Instalaciones gratis