
説明
リアルタイムでオシレーター・スキャナーを使って市場資産の動きを追跡しましょう!
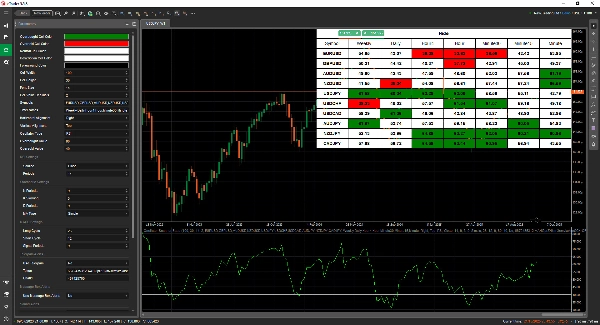
使いやすく強力なダッシュボードを備えたオシレーター・スキャナーは、異なる資産や期間にわたるモメンタムとオシレーター信号に依存するトレーダーに最適なツールです。
設定可能なリアルタイムのオシレーター・データの監視と比較機能により、より迅速かつ賢明な行動を取ることができます。
利用可能なオシレーター:
- RSI
- ストキャスティクスD
- ストキャスティクスK
- MACD
- MACDシグナル
- アクセラレーター・オシレーター
- オーサム・オシレーター
- ベアーズパワー
- ブルズパワー
- チャンデ・モメンタム・オシレーター
- コモディティ・チャネル・インデックス
- サイバーサイクル
- デマーカー
さまざまな種類のアラート - 迅速に通知を受け取る
任意のオシレーターがあなたのカスタマイズした買われ過ぎまたは売られ過ぎの基準を超えたときに通知を受け取れます。これにより、重要な市場イベントを見逃すことがありません。
🏍 重要な機能:
✅ 完全にパーソナライズ可能なウォッチリスト:監視する時間軸とシンボルを選択できます。
買われ過ぎ・売られ過ぎのレベルはあなたの取引スタイルに合わせて変更可能です。
✅ クイックチャート切り替え:任意のセルをクリックして他のチャートにアクセスできます。
✅ 簡潔でデータ駆動のデザイン:チャート間の移動に時間を無駄にせず、迅速な意思決定に最適です。
このツールは、トレンドの強さを監視するスイングトレーダーやポジショントレーダーに最適です。モメンタムの変化や急激な反転を見極めることは、デイトレーダーやスキャルパーにとって不可欠です。
重要なモメンタムの変化を常に把握できます!
オシレーター・スキャナーは、確認、反転、ブレイクアウトなどのモメンタム状況を監視するのに最適なツールです。
🔥 今すぐ入手して、より賢明な取引をしましょう!
概要
Users can personalize watchlists by selecting specific symbols and time periods, and adjust overbought and oversold levels to fit their trading strategies. The tool provides alert notifications when oscillator values cross user-defined thresholds, enabling timely responses to market momentum shifts such as confirmations, reversals, and breakouts.
The interface supports quick chart switching by clicking on any data cell, facilitating efficient analysis without navigating away from the dashboard. Oscillator Scanner is suited for swing and position traders focusing on trend strength, as well as day traders and scalpers who need to identify momentum changes rapidly. It supports multiple markets including Forex, indices, commodities, and cryptocurrencies.
カスタマーレビュー
5 | 67 % | |
4 | 33 % | |
3 | 0 % | |
2 | 0 % | |
1 | 0 % |


