
AlgoCorner McGinley Dynamic
Chỉ báo
60 lượt tải
Phiên bản 1.1, Jan 2026
Windows, Mac
Mô tả
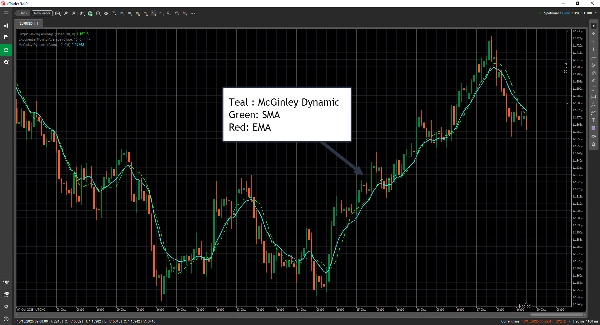
McGinley Dynamic là một trong những công cụ kỹ thuật bị đánh giá thấp nhưng thực sự xuất phát từ một quan sát rất thực tế về các trung bình động.
Nó được tạo ra bởi John R. McGinley, CMT, và mục đích chính của nó là giải quyết các vấn đề phổ biến của các trung bình động truyền thống — cụ thể là độ trễ và hiện tượng dao động giả do sự biến động tốc độ thị trường gây ra.
Dưới đây là những gì nó cố gắng giải quyết cụ thể:
🧩 1. Độ trễ trong các trung bình động
- Các trung bình động thông thường (SMA, EMA) bị trễ so với giá vì chúng dựa trên các khoảng thời gian cố định.
- McGinley Dynamic tự động điều chỉnh làm mượt dựa trên tốc độ thị trường.
Khi thị trường di chuyển nhanh, nó tăng tốc điều chỉnh; khi thị trường chậm lại, nó làm mượt nhẹ nhàng hơn.
👉 Kết quả: nó theo dõi giá sát hơn mà không phản ứng quá mức.
🌪️ 2. Hiện tượng dao động giả trong các giai đoạn biến động mạnh
- Các trung bình động truyền thống có thể đưa ra tín hiệu sai trong các thị trường biến động mạnh.
- McGinley đã giới thiệu một mẫu số động điều chỉnh tỷ lệ với tốc độ di chuyển của thị trường.
Điều này giúp giảm nhiễu và tránh các tín hiệu giao cắt không cần thiết.
⚙️ 3. Hành vi mượt mà hơn, tự điều chỉnh
- Nó hoạt động gần như một trung bình động tự điều chỉnh, nghĩa là bạn không cần phải tinh chỉnh khoảng thời gian quá nhiều.
- Điều này làm cho nó ít nhạy cảm hơn với đầu vào của người dùng và biến động thị trường — giống như một trung bình động “thông minh”.
Tóm tắt
Tóm tắt AI
AlgoCorner McGinley Dynamic is a technical indicator designed to improve upon traditional moving averages by reducing lag and false signals. Created by John R. McGinley, CMT, it automatically adjusts its smoothing based on market speed, allowing it to track price movements more closely without overreacting. The indicator employs a dynamic denominator that changes in proportion to market velocity, helping to minimize whipsaws and avoid unnecessary crossover signals during volatile or choppy market conditions. Acting as a self-correcting, auto-adjusting moving average, it requires less fine-tuning of parameters and is less sensitive to market volatility and user input. This makes it a practical tool for traders seeking a smoother, more responsive moving average that adapts naturally to changing market dynamics. It is applicable to Forex markets, including currency pairs such as EURUSD and GBPUSD.
Hồ sơ chỉ báo
Đánh giá của khách hàng
0.0
Đánh giá: 0
Đánh giá của khách hàng
Sản phẩm này chưa có đánh giá nào. Bạn đã dùng thử chưa? Hãy là người đầu tiên chia sẻ với mọi người!
Thảo luận
Câu hỏi thường gặp
Forex
EURUSD
GBPUSD
Các sản phẩm có sẵn trên cTrader Store, bao gồm bot giao dịch, chỉ báo và plugin, được cung cấp bởi các nhà phát triển bên thứ ba và chỉ nhằm mục đích cung cấp thông tin và tiếp cận kỹ thuật. cTrader Store không phải là nhà môi giới và không cung cấp lời khuyên đầu tư, khuyến nghị cá nhân hay bất kỳ đảm bảo nào về hiệu suất trong tương lai.


Giá
10
Lượt bán
351
Cài đặt miễn phí