
Penerangan
Apakah Lengkung Coppock?
Lengkung Coppock adalah penunjuk momentum jangka panjang yang asalnya direka untuk mengenal pasti dasar pasaran utama dalam S&P 500. Ia dicipta pada tahun 1962 oleh ahli ekonomi Edwin Coppock, yang terkenal apabila diminta oleh Gereja Episkopal untuk mencari peluang pembelian risiko rendah bagi dana endowmen mereka.
Dalam istilah mudah, ia adalah pengayun pengikut tren yang memberitahu anda bila pasaran beruang mungkin telah mencapai dasar dan pasaran lembu baru sedang bermula.
“Rahsia Istimewa” (Bagaimana Ia Berfungsi)
Tidak seperti banyak penunjuk yang mudah terkejut dan reaktif, Lengkung Coppock sengaja lambat. Ia dikira dengan mengambil Purata Bergerak Berbobot (WMA) daripada jumlah dua Kadar Perubahan (ROC) yang berbeza.
Coppock = WMA(10) bagi (ROC(14) + ROC(11))
Logiknya:
Ia mengukur kadar perubahan momentum harga dalam tempoh panjang (biasanya 11 dan 14 bulan). Dengan melicinkan data ini menggunakan purata berbobot, ia menapis hampir semua bunyi pasaran jangka pendek.
Fakta Menarik:
Coppock dikatakan bertanya kepada para uskup berapa lama masa yang diambil seseorang untuk pulih daripada kesedihan kehilangan orang tersayang. Mereka berkata “11 hingga 14 bulan.” Dia menggunakan jangka masa yang sama ini untuk pasaran, dengan alasan psikologi pasaran mengikuti kitaran kesedihan dan pemulihan yang serupa.
Mengapa Ia Berguna?
Pedagang dan pelabur menyukai Lengkung Coppock atas tiga sebab utama:
- Ia Menapis Bunyi: Kerana ia dikira berdasarkan jangka masa bulanan (secara tradisional), ia mengabaikan turun naik harian atau mingguan. Ia tidak kerap mencetuskan isyarat, tetapi apabila ia berlaku, biasanya signifikan.
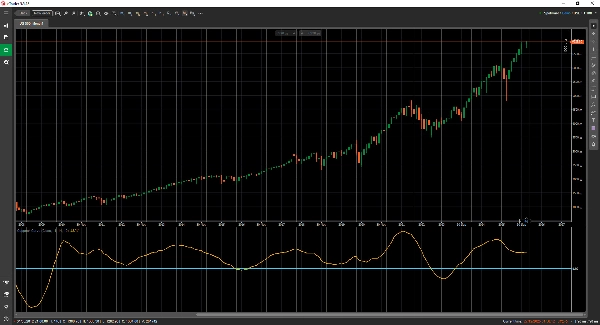
- Isyarat Beli yang Jelas: Isyarat adalah binari dan mudah dibaca. Isyarat “Beli” dijana apabila lengkung berada di bawah garis sifar dan mula naik (bermula meningkat).
- Jangkar Psikologi: Ia menghalang anda daripada cuba “menangkap pisau yang jatuh.” Ia memaksa anda menunggu sehingga momentum secara matematik berubah dari negatif ke positif sebelum memasuki posisi.
Bila Menggunakannya
- Terbaik untuk: Pelaburan jangka panjang, peruntukan persaraan, dan mengenal pasti permulaan larian lembu baru.
- Tidak untuk: Perdagangan harian atau penjualan singkat. Ia tidak direka untuk mengenal pasti isyarat jual atau puncak pasaran.


![Logo "[Stellar Strategies] Smart ADX"](https://cdn.ctrader.com/image/webp/af13b084-b6f6-41db-b7bc-c7e688b57b05_36929)


