


Penerangan
#### Ciri-ciri
- **Jangka Masa Boleh Disesuaikan**: Pengguna boleh memilih jangka masa tertentu (contohnya, harian) untuk menganalisis tahap pembukaan. Jangan tetapkan sebarang TF < 1H.
- **Tempoh Lihat Semula**: Penunjuk menyokong tempoh lihat semula, membolehkan pedagang memberi tumpuan kepada tindakan harga terkini dan mengenal pasti titik-titik kepentingan yang relevan.
- **Garis Tren Dinamik**: Ia melukis garis tren untuk menunjukkan harga pembukaan jangka masa yang dipilih, memberikan petunjuk visual yang jelas untuk tahap sokongan dan rintangan yang berpotensi.
- **Pilihan Pelabelan**: Pedagang boleh mengaktifkan label untuk memaparkan harga pembukaan terus pada carta, meningkatkan kejelasan dan pemahaman.
- **Penyesuaian Visual**: Pengguna boleh menyesuaikan warna garis, gaya, dan ketebalan mengikut citarasa mereka dan meningkatkan keterbacaan carta.
- **Sekatan Jangka Masa**: Penunjuk termasuk pemeriksaan untuk memastikan ia beroperasi hanya dalam tetapan jangka masa minimum dan maksimum yang ditetapkan, mengelakkan isyarat yang mengelirukan.
#### Tutorial
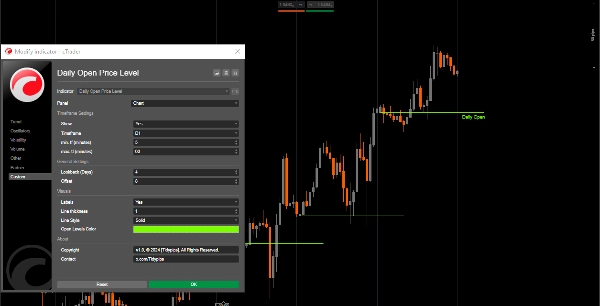
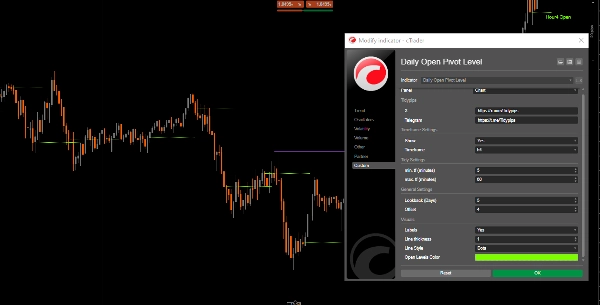
1. **Persediaan**: Buka tetapan penunjuk untuk memilih jangka masa yang dikehendaki, tempoh lihat semula, dan sesuaikan parameter visual seperti warna garis dan ketebalan.
2. **Menggunakan Penunjuk**: Setelah digunakan, penunjuk akan secara automatik melukis tahap harga pembukaan pada carta anda berdasarkan tetapan yang ditentukan.
3. **Analisis**: Perhatikan tahap yang dilukis semasa anda berdagang. Gunakan tahap ini untuk mengenal pasti zon sokongan dan rintangan yang berpotensi, dan membuat keputusan perdagangan yang berinformasi.
#### Alat Pendamping yang Disyorkan
- **cTrader**: Platform asli untuk cAlgo, menyediakan pengalaman lancar untuk menggunakan dan menyesuaikan penunjuk.
- **Alat Analisis Teknikal**: Gabungkan penunjuk ini dengan alat lain seperti purata bergerak atau osilator untuk meningkatkan strategi perdagangan dan analisis pasaran anda.
- **Alat Pengurusan Risiko**: Gunakan kalkulator saiz posisi dan alat hentian rugi untuk mengurus risiko dengan berkesan semasa berdagang sekitar tahap pembukaan yang dikenal pasti.
Dengan mengintegrasikan Penunjuk Tahap Pivot Pembukaan Harian dengan alat-alat ini, pedagang boleh meningkatkan analisis pasaran mereka dan memperbaiki peluang kejayaan dalam mengendalikan kerumitan perdagangan intrahari.
Ringkasan
Ulasan pelanggan
5 | 100 % | |
4 | 0 % | |
3 | 0 % | |
2 | 0 % | |
1 | 0 % |


