
คำอธิบาย
เบื่อกับการใช้เวลานานในการทำเครื่องหมายบนชาร์ตของคุณหรือไม่? ตัวบ่งชี้นี้ทำให้คุณได้อย่างรวดเร็วมาก
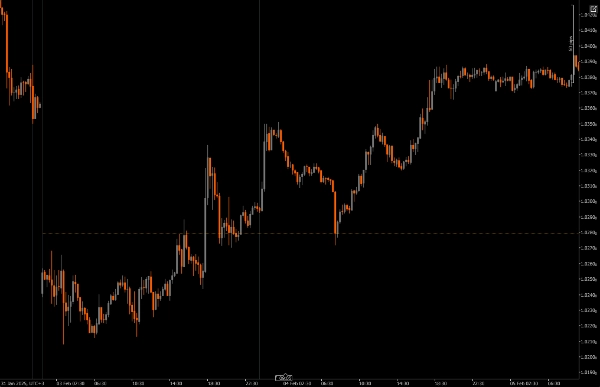
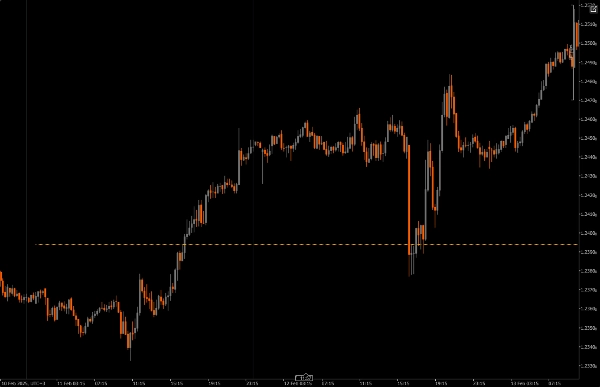
มันจะหาจุดกึ่งกลางระหว่างราคาสูงสุดและต่ำสุดของวันก่อนหน้า และวางบนชาร์ตของคุณ ตอนนี้คุณสามารถสแกนชาร์ตของคุณได้อย่างรวดเร็ว ง่ายมาก!
คุณสมบัติเจ๋งๆ บางอย่าง
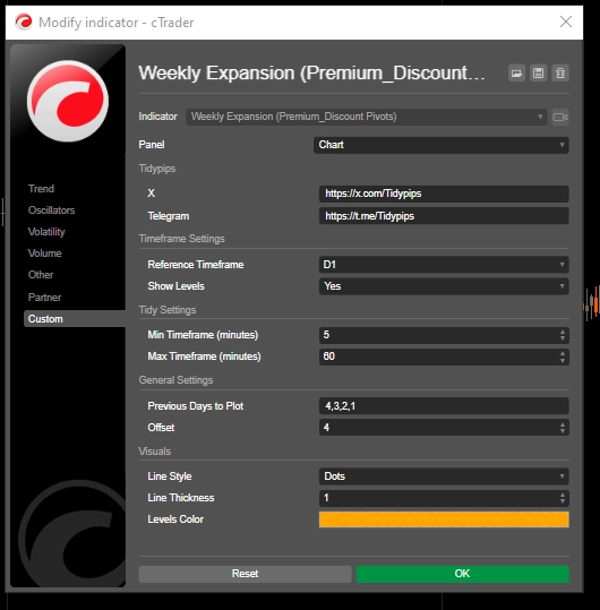
กรอบเวลาที่อ้างอิงได้ตามต้องการ: คุณสามารถเลือกกรอบเวลาขั้นต่ำและสูงสุดเพื่อวางระดับราคาที่สำคัญ ซึ่งช่วยให้การเทรดภายในวันของคุณสอดคล้องกับแนวโน้มตลาดที่กว้างขึ้น
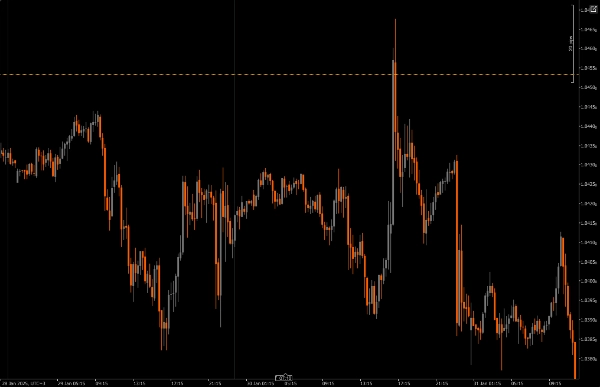
สิ่งที่ทำให้ตัวบ่งชี้นี้พิเศษคือความสามารถในการติดตามแท่งเทียนรายสัปดาห์ขณะที่มันพิมพ์ออกมาในแต่ละวัน ทำให้ง่ายต่อการจับการขยายตัวของแท่งเทียนรายสัปดาห์
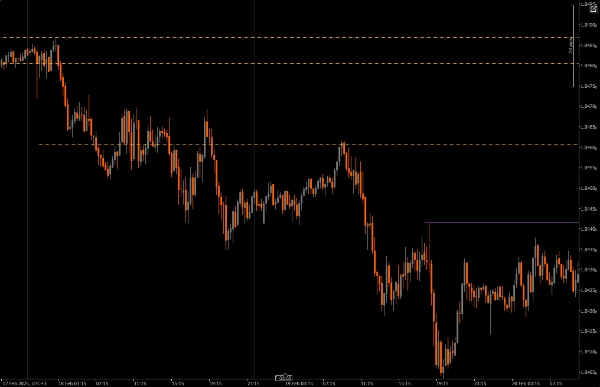
พารามิเตอร์ Offset: ฟีเจอร์นี้ช่วยให้คุณตัดสินใจได้ว่าระดับที่วางจะขยายไปในอนาคตไกลแค่ไหน ทำให้คุณเห็นภาพชัดเจนขึ้นเกี่ยวกับโซนที่อาจเป็นไปได้ของการต่อเนื่องราคาที่จะเกิดขึ้น
การปรับแต่งภาพ: คุณมีตัวเลือกมากมายในการปรับแต่งสไตล์เส้น ความหนา และสี ทำให้ง่ายต่อการสร้างชาร์ตที่เหมาะกับสไตล์ส่วนตัวของคุณและอ่านง่าย
ข้อจำกัดของกรอบเวลา: ตัวบ่งชี้มีการตรวจสอบเพื่อให้แน่ใจว่าจะทำงานเฉพาะภายในการตั้งค่ากรอบเวลาที่คุณระบุไว้เท่านั้น ดังนั้นคุณจึงหลีกเลี่ยงความยุ่งเหยิงบนชาร์ตเมื่อเปลี่ยนกรอบเวลาอื่นๆ
ข้อควรทราบ:
สิ่งที่ชอบส่วนตัว
ถ้าคุณเหมือนฉันและไม่สามารถละสายตาจากลิปสติกบนชาร์ตของคุณได้ ลองใช้ตัวบ่งชี้นี้ดู มีข้อจำกัดกรอบเวลาและฟังก์ชันช่วงเวลาย้อนหลังที่มุ่งลดความยุ่งเหยิงบนชาร์ต
ตัวบ่งชี้นี้มีประโยชน์ในการติดตามการพัฒนาแท่งเทียนรายสัปดาห์; หากการขยายตัวรายสัปดาห์แสดงสัญญาณของการไหลคำสั่งซื้อแบบขาขึ้น ระดับ pivot บนตัวบ่งชี้นี้จะแสดงพื้นที่หรือโซนเพื่อเข้าร่วมการขยายตัวแบบขาขึ้น ในทำนองเดียวกัน หากการขยายตัวรายสัปดาห์แสดงการไหลคำสั่งขายแบบขาลง ระดับ pivot บนตัวบ่งชี้นี้จะแสดงพื้นที่หรือโซนเพื่อเข้าร่วมการขยายตัวแบบขาลง
การติดตั้ง: เริ่มต้นด้วยการดาวน์โหลดและติดตั้ง Previous Day Equilibrium บนแพลตฟอร์ม cAlgo ของคุณ
การตั้งค่า: เปิดการตั้งค่าเพื่อเลือกกรอบเวลาอ้างอิงของคุณ เลือกจำนวนวันที่ต้องการวาง และปรับแต่งการตั้งค่าภาพตามที่คุณชอบ
การวิเคราะห์: ขณะที่คุณเทรด ให้สังเกตระดับที่วางบนชาร์ตของคุณ ระดับเหล่านี้บ่งชี้ว่าราคาน่าจะกลับตัวจากจุดใดโดยอิงจากการเคลื่อนไหวของราคาประวัติศาสตร์ ช่วยให้คุณตัดสินใจได้อย่างมีข้อมูลมากขึ้น
การดำเนินการ: ใช้ระดับเหล่านี้เพื่อกำหนดจุดเข้าและออก รวมถึงคำสั่งหยุดขาดทุนและทำกำไร รวมเข้ากับกลยุทธ์การเทรดโดยรวมของคุณ
เครื่องมือแนะนำที่ควรใช้ร่วมกัน:
cTrader: นี่คือแพลตฟอร์มที่ดีที่สุดสำหรับการใช้ Previous Day Equilibrium ให้ประสบการณ์ที่ราบรื่นสำหรับการปรับแต่งและการวิเคราะห์
เครื่องมือวิเคราะห์ทางเทคนิค: จับคู่ตัวบ่งชี้นี้กับเครื่องมืออื่นๆ เช่น ค่าเฉลี่ยเคลื่อนที่หรือออสซิลเลเตอร์ เพื่อให้ได้ภาพรวมแนวโน้มตลาดที่ครบถ้วนมากขึ้น
เครื่องมือบริหารความเสี่ยง: ใช้เครื่องคิดเลขและเครื่องมือหยุดขาดทุนเพื่อช่วยบริหารความเสี่ยงของคุณอย่างมีประสิทธิภาพขณะเทรดรอบระดับสำคัญเหล่านี้
โดยการใช้ Previous Day Equilibrium ร่วมกับเครื่องมือเหล่านี้ คุณสามารถเพิ่มประสิทธิภาพกลยุทธ์การเทรดของคุณและเพิ่มโอกาสความสำเร็จในโลกการเทรดภายในวันที่รวดเร็ว
สรุป
รีวิวจากลูกค้า
5 | 0 % | |
4 | 100 % | |
3 | 0 % | |
2 | 0 % | |
1 | 0 % |


