
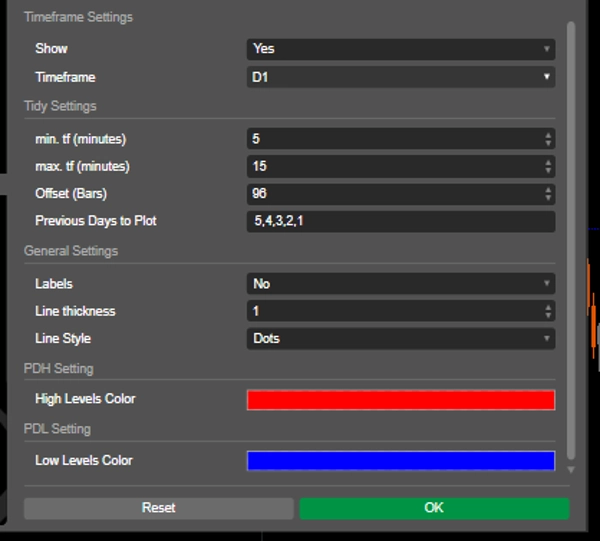

Penerangan
Alat ini membolehkan pengguna menentukan jangka masa untuk analisis, seperti harian, dan melukis paras tinggi dan rendah pada carta mereka dengan warna, gaya, dan ketebalan yang boleh disesuaikan. Ia menyokong pelbagai hari sebelumnya, memudahkan untuk mengenal pasti zon tindakan harga yang penting. Penunjuk ini juga mempunyai label pilihan untuk kejelasan, membantu pedagang membuat keputusan yang berinformasi berdasarkan data harga sejarah. Sesuai untuk pedagang baru dan berpengalaman, alat ini meningkatkan analisis pasaran dan strategi perdagangan.
Ciri-ciri
Jangka Masa Boleh Disesuaikan: Pengguna boleh memilih jangka masa tertentu (contohnya, harian) untuk menganalisis paras tinggi dan rendah sebelumnya, membolehkan visualisasi yang disesuaikan mengikut strategi perdagangan mereka.
Pelbagai Hari Sebelumnya: Keupayaan untuk melukis paras tinggi dan rendah bagi pelbagai hari sebelumnya memberikan pandangan menyeluruh tentang zon tindakan harga yang penting.
Garis Tren Dinamik: Penunjuk melukis garis tren untuk paras tinggi dan rendah hari sebelumnya, memudahkan untuk mengenal pasti zon pembalikan potensi dengan cepat.
Pilihan Pelabelan: Pengguna boleh mengaktifkan label untuk memaparkan nilai tinggi dan rendah semasa terus pada carta, meningkatkan kejelasan dan kefahaman.
Penyesuaian Visual: Pedagang boleh menyesuaikan warna garis, gaya, dan ketebalan mengikut keutamaan mereka dan meningkatkan keterbacaan carta.
Sekatan Jangka Masa: Penunjuk memastikan ia beroperasi hanya dalam tetapan jangka masa minimum dan maksimum yang ditentukan, mengurangkan kekacauan carta semasa menukar antara jangka masa lain.
Perkara yang Perlu Diperhatikan
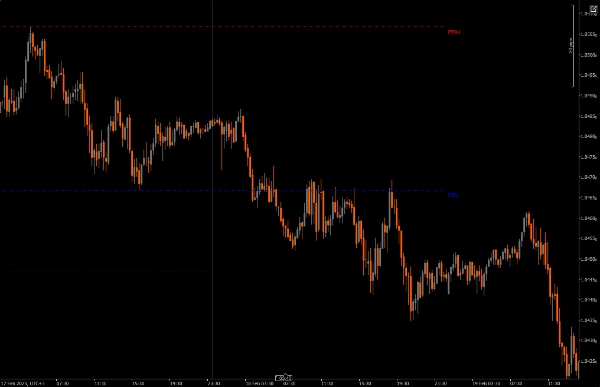
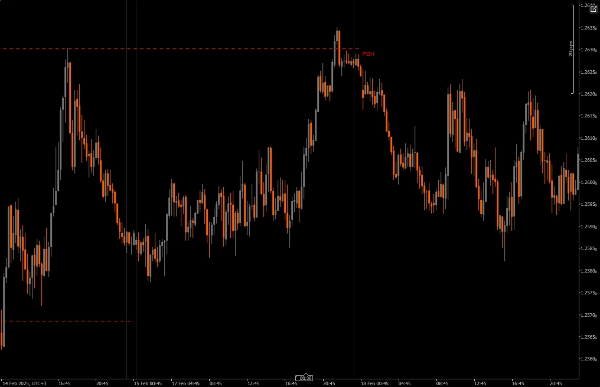
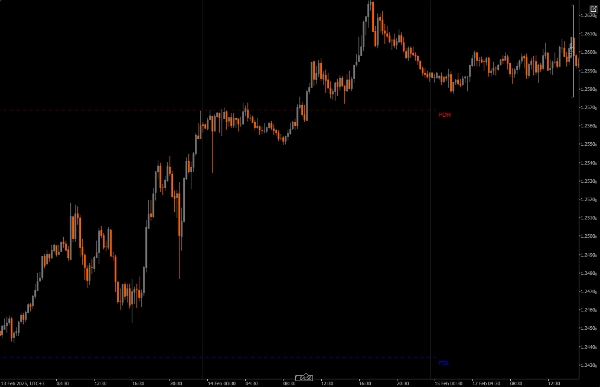
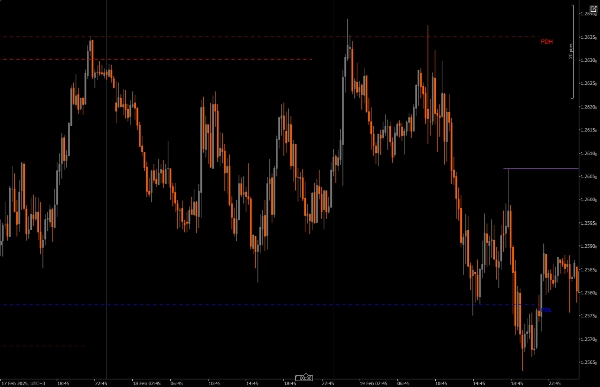
PDH atau PDL dalam pasaran boleh digunakan sebagai lukisan pada kecairan (DOL) atau digunakan untuk membingkai pembalikan.
Pembalikan boleh dibingkai dari PDH dan PDL apabila terdapat kegagalan untuk mengalihkan.
Apabila harga menghormati susunan PD di atas atau di bawah, gagal mengalihkan melebihi paras tinggi atau rendah Harian, lilin seterusnya boleh dijangka.
Adakah harga lebih cenderung mencapai paras tinggi atau rendah hari sebelumnya? Apabila menggunakan PDH PDL sebagai lukisan pada kecairan (DOL)
Pemasangan: Muat turun dan pasang Daily Range Liquidity Zones (PDH PDL) pada platform cAlgo anda.
Persediaan: Buka tetapan penunjuk dan pilih jangka masa yang dikehendaki untuk analisis, bilangan hari sebelumnya untuk dilukis, dan sesuaikan parameter visual seperti warna dan ketebalan garis.
Menggunakan Penunjuk: Penunjuk akan secara automatik melukis paras tinggi dan rendah hari sebelumnya pada carta anda berdasarkan tetapan yang ditentukan.
Analisis: Perhatikan paras yang dilukis semasa anda berdagang. Gunakan paras ini untuk membingkai pembalikan potensi, dan buat keputusan perdagangan yang berinformasi.
Alat Pendamping yang Disyorkan
cTrader: Platform asli untuk cAlgo, menyediakan persekitaran lancar untuk menggunakan dan menyesuaikan penunjuk.
Alat Analisis Teknikal: Gabungkan penunjuk ini dengan alat lain seperti Fair Value Gaps (FVG) dan Penunjuk Corak Pembalikan (CRT) untuk meningkatkan strategi perdagangan dan analisis pasaran anda.
Alat Pengurusan Risiko: Gunakan kalkulator saiz posisi dan alat stop-loss untuk mengurus risiko dengan berkesan semasa berdagang di sekitar paras tinggi dan rendah yang dikenal pasti.
Dengan mengintegrasikan Daily Range Liquidity Zones (PDH PDL) dengan alat-alat ini, pedagang dapat meningkatkan analisis pasaran mereka dan memperbaiki peluang kejayaan dalam menavigasi kerumitan tindakan harga.
Ringkasan
Ulasan pelanggan
5 | 100 % | |
4 | 0 % | |
3 | 0 % | |
2 | 0 % | |
1 | 0 % |


