
Deskripsi
*WAKTU PEMBUKAAN AKAN BERBEDA ANTARA KELAS ASET
*NILAI WAKTU DEFAULT UNTUK NQ/ES/YM (FUTURES)
*NILAI WAKTU HARUS DALAM EASTERN STANDARD TIME (EST)
Fitur Utama:
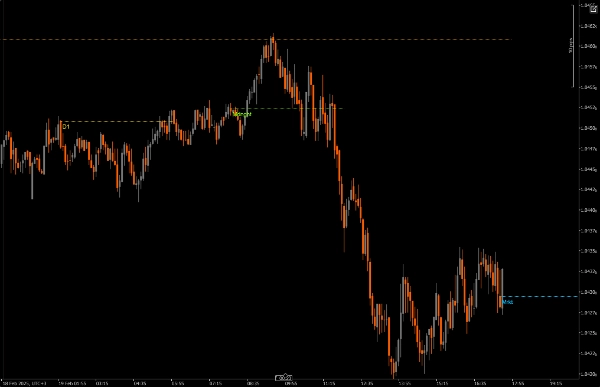
Level Harga Berbasis Waktu
Menggambar garis harga pembukaan pada harga pembukaan waktu pasar utama
Semua waktu disinkronkan dengan Eastern Standard Time (EST)
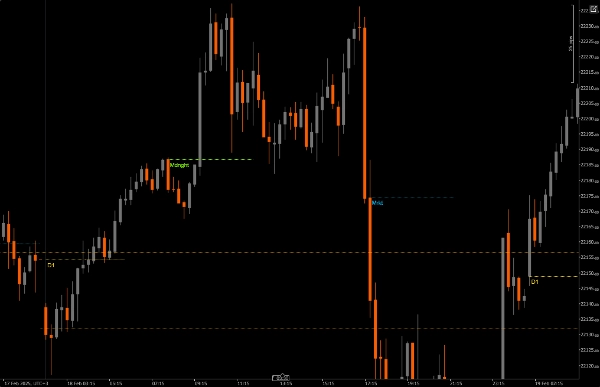
Setiap periode waktu diberi kode warna untuk identifikasi mudah
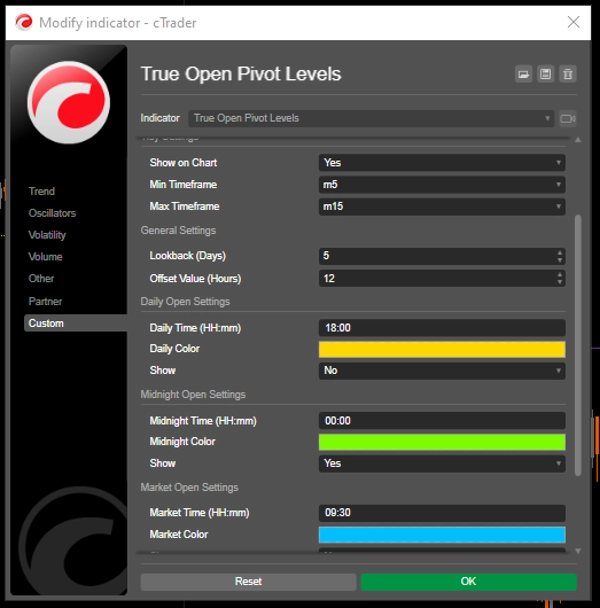
3 Penanda Sesi yang Dapat Disesuaikan:
Pembukaan Harian (12:00 AM EST) - Default Emas
Pembukaan Tengah Malam (4:00 AM EST) - Default Hijau
Pembukaan Pasar (9:30 AM EST) - Default Biru
Setiap sesi dapat diaktifkan/nonaktifkan secara independen
Kustomisasi Visual:
Ketebalan garis yang dapat disesuaikan
Berbagai gaya garis (padat, titik-titik, putus-putus)
Warna yang dapat disesuaikan untuk setiap sesi
Label waktu opsional yang menunjukkan waktu EST
Offset garis dapat dikonfigurasi hingga 48 jam
Dukungan Kerangka Waktu Fleksibel:
Atur kerangka waktu minimum dan maksimum untuk tampilan
Mencegah kekacauan grafik pada kerangka waktu yang tidak sesuai
Dioptimalkan untuk kerangka waktu M5-M15
Pengaturan Waktu:
Semua waktu dalam EST
Sesuaikan waktu sesi agar sesuai dengan strategi trading Anda
Sesuaikan durasi garis berdasarkan kebutuhan analisis Anda
Pengaturan Visual:
Sesuaikan ketebalan garis untuk visibilitas
Pilih gaya garis berdasarkan kejelasan grafik
Aktifkan/nonaktifkan label sesuai kebutuhan
Sesuaikan warna agar sesuai dengan tema grafik Anda
Pengaturan Umum:
Tentukan kerangka waktu minimum/maksimum
Sesuaikan durasi garis untuk analisis yang diperpanjang
Praktik Terbaik:
Mulailah dengan pengaturan default dan sesuaikan sesuai kebutuhan Anda
Gunakan warna berbeda untuk setiap sesi agar perbedaan jelas
Pertimbangkan mengurangi durasi garis pada kerangka waktu rendah untuk mencegah kekacauan
Aktifkan label pada awalnya untuk memahami waktu, nonaktifkan jika grafik menjadi terlalu ramai
Sesuaikan pengaturan kerangka waktu indikator dengan kerangka waktu trading Anda
Indikator ini sangat berguna untuk:
Trader harian yang fokus pada pasar AS
Trader yang perlu melacak pembukaan sesi
Mereka yang berdagang di sekitar peristiwa pasar utama
Trader yang menganalisis aksi harga multi-sesi
Siapa pun yang membutuhkan referensi visual yang jelas untuk waktu pasar EST
Ringkasan
Ulasan pelanggan
5 | 100 % | |
4 | 0 % | |
3 | 0 % | |
2 | 0 % | |
1 | 0 % |


![Logo "[Stellar Strategies] MARSI Signal Plotter"](https://cdn.ctrader.com/image/webp/7b2b8da6-8f8e-4646-8d4a-4710c516c01e_25567)


