
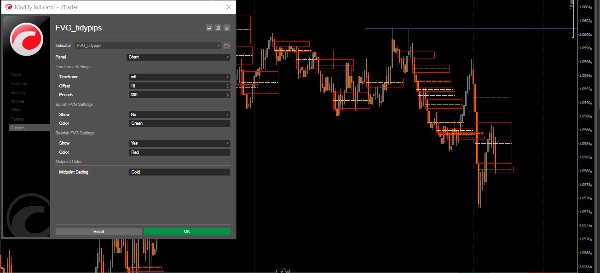
FVG_tidypips
Indikator
13 pembelian
Versi 1.0, Nov 2024
Windows, Mac
4.3
Ulasan: 3

Deskripsi
Indikator Fair Value Gap (FVG) ini adalah alat analisis teknis yang membantu trader mengidentifikasi ketidakseimbangan harga.
Fitur:
- Alihkan visibilitas gap bullish dan/atau bearish
- Menampilkan kotak berwarna untuk visualisasi mudah (default: hijau untuk bullish, merah untuk bearish, emas untuk level titik tengah)
- Periode lookback yang dapat disesuaikan untuk mengurangi kekacauan grafik
- Pengaturan ekstensi kotak yang dapat dikonfigurasi (offset) untuk visualisasi yang lebih baik
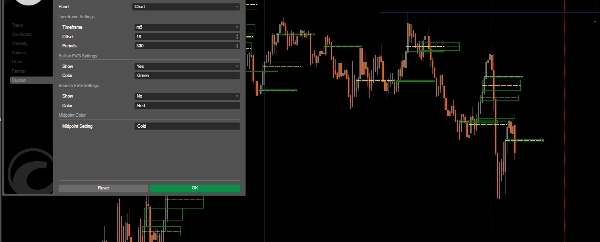
Parameter:
- Timeframe: Pilih timeframe favorit Anda untuk menampilkan FVG
- Offset: Sesuaikan ekstensi horizontal kotak FVG (3-500)
- Periode: Atur periode lookback untuk perhitungan FVG historis
- Tampilkan FVG Bullish/Bearish
- Warna: Sesuaikan warna untuk FVG bullish, FVG bearish, dan garis titik tengah
Aplikasi Trading:
- Support dan Resistance: FVG sering berfungsi sebagai level support/resistance yang kuat
- Magnet Harga: Gap yang tidak terisi cenderung menarik aksi harga (DOL)
- Struktur Pasar: Membantu mengidentifikasi zona pembalikan potensial dan titik kelanjutan yang menarik
- Analisis Order Block: Menemukan zona trading institusional
Praktik Terbaik Aplikasi:
- Gunakan bersama dengan alat analisis teknis lainnya.
- Timeframe yang lebih tinggi menghasilkan FVG yang lebih signifikan, Timeframe lebih rendah digunakan dengan Bias Arah Timeframe lebih tinggi
- Pantau bagaimana harga bereaksi saat kembali ke zona FVG
- Perhatikan garis titik tengah karena sering berfungsi sebagai magnet harga
Lihat indikator berguna lainnya yang telah saya publikasikan. Jika Anda merasa indikator ini—atau indikator saya lainnya—berguna, pertimbangkan untuk mendukung pekerjaan saya dengan membeli atau berdonasi. Dukungan Anda tidak hanya membantu saya terus mengembangkan dan meningkatkan alat ini, tetapi juga memastikan saya dapat terus menciptakan indikator baru yang berharga untuk meningkatkan pengalaman trading Anda. Terima kasih atas dukungan Anda yang berkelanjutan!
https://buymeacoffee.com/tidypips
Ringkasan
Ringkasan AI
The FVG_tidypips indicator is a technical analysis tool designed to identify Fair Value Gaps (FVGs), which represent price imbalances on trading charts. It visually highlights bullish and bearish gaps using color-coded boxes—green for bullish, red for bearish, and gold for midpoint levels—facilitating quick recognition of potential support and resistance zones. Users can toggle the visibility of bullish and/or bearish gaps, adjust the lookback period to manage chart clutter, and configure the horizontal extension (offset) of the FVG boxes for clearer visualization.
Key parameters include selecting the timeframe for FVG display, setting the offset range (3–500), defining the lookback period for historical gap calculation, and customizing colors for different gap types and midpoint lines. The indicator supports trading applications such as identifying strong support/resistance levels, spotting price magnets where unfilled gaps attract price action, analyzing market structure for potential reversal or continuation zones, and detecting institutional order block areas.
Best practices recommend using this indicator alongside other technical tools, focusing on higher timeframes for more significant FVGs, and monitoring price reactions when revisiting FVG zones. The midpoint line is noted as an important price magnet. This tool is applicable across various markets, including commodities like gold (XAUUSD).
Profil indikator
Ulasan pelanggan
4.3
Ulasan: 3
5 | 33 % | |
4 | 67 % | |
3 | 0 % | |
2 | 0 % | |
1 | 0 % |
Ulasan pelanggan
November 22, 2024
Good idea with limits for traders who use ICT or SMC concepts. It gives value around smart money style analysis, but zones still need manual validation. A good sample is 20 FVG or order block reactions, with messy 0.705 areas skipped. The zone is more convincing when structure and risk both make sense.
November 21, 2024
November 21, 2024
Small but practical edge for smart money style analysis. it adds structure around liquidity, gaps and market shifts, especially when used for mapping zones before entries. For SMC logic, I trust zones more when 0.5 mitigation, BOS and liquidity sweep line up. The zone is more convincing when structure and risk both make sense.
Diskusi
Pertanyaan umum
Commodities
XAUUSD
Produk-produk yang tersedia melalui cTrader Store, termasuk bot trading, indikator, dan plugin, disediakan oleh pengembang pihak ketiga serta hanya ditujukan untuk akses teknis dan informasi. cTrader Store bukan broker dan tidak menyediakan saran investasi, rekomendasi pribadi, atau jaminan apa pun tentang kinerja di masa mendatang.
Produk lain dari penulis ini


Harga
15
Penjualan
4.62K
Instal gratis