


Description
#### Fonctionnalités
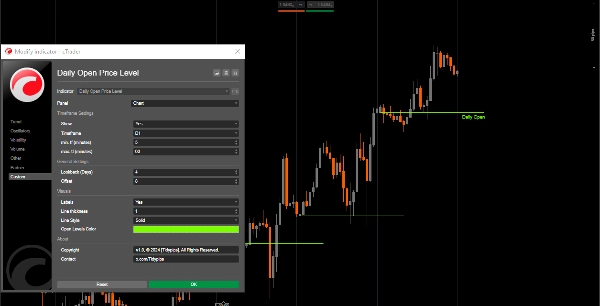
- **Période personnalisable** : Les utilisateurs peuvent sélectionner une période spécifique (par exemple, quotidienne) pour analyser les niveaux d'ouverture. Ne définissez pas de TF < 1H.
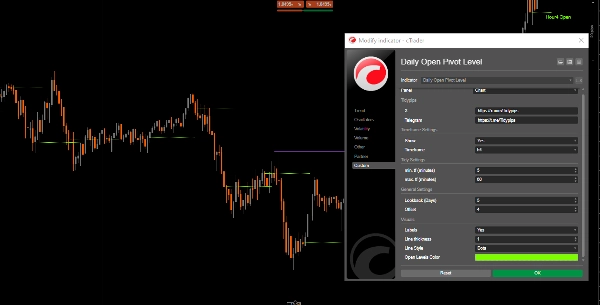
- **Période de rétrospection** : L'indicateur prend en charge une période de rétrospection, permettant aux traders de se concentrer sur l'action des prix récente et d'identifier les points d'intérêt pertinents.
- **Lignes de tendance dynamiques** : Il trace des lignes de tendance pour indiquer le prix d'ouverture de la période sélectionnée, fournissant des repères visuels clairs pour les niveaux potentiels de support et de résistance.
- **Options d'étiquetage** : Les traders peuvent activer les étiquettes pour afficher le prix d'ouverture directement sur le graphique, améliorant la clarté et la compréhension.
- **Personnalisation visuelle** : Les utilisateurs peuvent personnaliser les couleurs, styles et épaisseurs des lignes selon leurs préférences pour améliorer la lisibilité du graphique.
- **Restrictions de période** : L'indicateur inclut des vérifications pour s'assurer qu'il fonctionne uniquement dans les plages de période minimale et maximale spécifiées, évitant ainsi des signaux trompeurs.
#### Tutoriel
1. **Configuration** : Ouvrez les paramètres de l'indicateur pour sélectionner la période souhaitée, la période de rétrospection, et personnaliser les paramètres visuels comme la couleur et l'épaisseur des lignes.
2. **Utilisation de l'indicateur** : Une fois appliqué, l'indicateur tracera automatiquement les niveaux de prix d'ouverture sur votre graphique en fonction des paramètres spécifiés.
3. **Analyse** : Observez les niveaux tracés pendant que vous tradez. Utilisez ces niveaux pour identifier les zones potentielles de support et de résistance, et prendre des décisions de trading éclairées.
#### Outils complémentaires recommandés
- **cTrader** : La plateforme native pour cAlgo, offrant une expérience fluide pour l'utilisation et la personnalisation des indicateurs.
- **Outils d'analyse technique** : Combinez cet indicateur avec d'autres outils comme les moyennes mobiles ou les oscillateurs pour améliorer votre stratégie de trading et votre analyse de marché.
- **Outils de gestion des risques** : Utilisez des calculateurs de taille de position et des outils de stop-loss pour gérer efficacement le risque lors du trading autour des niveaux d'ouverture identifiés.
En intégrant l'indicateur Daily Open Pivot Level avec ces outils, les traders peuvent améliorer leur analyse de marché et augmenter leurs chances de succès dans la gestion des complexités du trading intrajournalier.
Résumé
Avis clients
5 | 100 % | |
4 | 0 % | |
3 | 0 % | |
2 | 0 % | |
1 | 0 % |


![Logo de "Gaussian Channel [Iridio Capital]"](https://cdn.ctrader.com/image/webp/7c039209-5573-4a54-a072-f9528b503103_41960)


