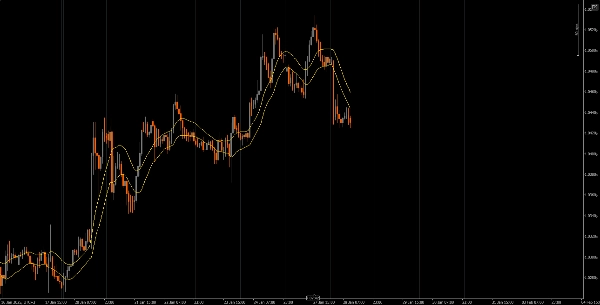
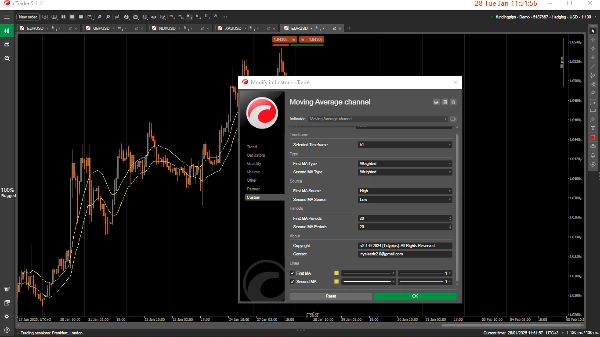
Moving Average channel
Logo de "Moving Average channel"
03/09/2025
102
Desktop
Depuis le 19/11/2024
Ventes
15
Installations gratuites
2665
Image mise en ligne de "Moving Average channel"Image mise en ligne de "Moving Average channel"

Customizable moving averages (MAs) on a chart, using different types of MAs (Simple, Weighted, Exponential) and price data sources (Close, Open, High, Low)
The WMA and SMA Indicator provides flexibility in visualizing moving averages based on user-defined parameters. It supports three types of moving averages: Simple (SMA), Weighted (WMA), and Exponential (EMA). The user can apply these averages to various data sources like Close, Open, High, Low, or calculated values such as Median, Typical, and Weighted Prices.

This tool also lets you select the timeframe for which the indicator is active, ensuring you focus on specific data periods without cluttering your charts with unnecessary information.

Check out other useful indicators that I’ve published. If you find this one—or any of my other indicators—helpful, consider supporting my work by purchasing or donating. Your support not only helps me continue developing and improving these tools, but it also ensures I can keep creating new, valuable indicators to enhance your trading experience. Thank you for your continued support!


https://buymeacoffee.com/tidypips

0.0
Avis : 0
Avis clients
Il n'y a pas encore d'avis sur ce produit. Vous l'avez déjà essayé ? Soyez le premier à en parler aux autres !
Plus de cet auteur
ICT Killzone and Sessions high_low
This indicator is an essential tool for traders seeking to visualize key trading sessions on their charts.
Indicateur
XAUUSD
Commodities
FVG_tidypips
A Fair Value Gap (FVG) indicator that identifies potential price imbalances, potential reversal and continuation zones
Previous Day Liquidity Zones (PDH - PDL)
Useful indicator for traders who want to visualize key price levels based on previous daily highs and lows.
Daily Open Pivot Level
This indicator is a valuable tool for traders looking to identify significant opening price level of any asset.
Drawing Utility
A rectangular box with 5 adjustable Fibonacci level or even custom ones.
Indicateur
XAUUSD
Commodities
True Open Pivot Levels
This indicatorFull Description: Th shows the open price lines at key market times based on Eastern Standard Time (EST).
Previous Day Equilibrium (Premium & Discount)
Plots the equilibrium price levels based on previous daily highs and lows.
Vous pourriez aussi aimer
Indicateur
NAS100
NZDUSD
XAUUSD
+11
Volume Profile Pro
Visualize trading volume by price within any range, highlight POC and key value areas.
Indicateur
RSI
Breakout
XAUUSD
+4
ZScore Reversion
Z-Score: Measures price deviations from its mean. Spots overbought/sold (±2-3 SD) & reversals. Key for stats trading
Indicateur
NAS100
RSI
NZDUSD
+15
RSI + EMA Crossover Signals
Dual confirmation RSI + EMA crossover signals with visual alerts and dynamic ATR offsets.
Indicateur
RSI
Breakout
XAUUSD
+6
Volume POC Heatmap
📊 Shows volume by price levels, highlights POC, and key zones. Identifies dynamic support/resistance and imbalances.
Chaikin Money Flow
Chaikin money flow's primary purpose is to distinguish between periods of accumulation and distribution of a security.
Indicateur
Indices
ATR
Forex
+1
FREE Risk Reward Guardian Scalping Swing Intraday Assistant
Trade fearlessly: auto-adjusts order blocks, manages risks, and ensures precision. Was Free for early users now -80%
VegaXLR - Fibonacci Bands
Customizable Dynamic Fibonacci Channels and Smart Alerts
PriceLevels
Displays the previous day's, last week's, and last month's highest and lowest price levels on your chart.
Indicateur
RSI
Breakout
Supertrend
+3
Fibonacci Linear Regression Multi-timeframe
Combining Fibonacci levels and regression to analyze multidimensional market trends across multiple timeframes¡
Indicateur
Breakout
ATR
Signal
UT Bot
ATR-based trend following tool with trailing stop logic. Highlights crossovers using clean up/down bands and bar colour.
Indicateur
Grid
XAUUSD
Forex
+3
Daily Open Color Zones
indicator showing the Daily Open Line and instantly shading bullish and bearish zones.
ScalperSignalVisual
Overview of the Fade Breakout Visualizer Indicator
Indicateur
NZDUSD
Forex
EURUSD
+2
AlgoCorner Market Sessions
Show each Market Session with full details, including grid mode for higher timeframes, statistics, and other metrics.
Indicateur
Breakout
AI
Scalping
KaufmanEfficiencyRatio
A precision tool for measuring how efficiently price moves from point A to B.
Parabolic RSI Alert  V1
Master RSI reversals with Parabolic SAR precision! Get real-time alerts for high-probability trend changes.
Block Order Rreversal
Order BlockIndicator reversal
Indicateur
Indices
Stocks
Forex
+1
TwoSMA.cs
An indicator that accurately shows the trend direction. A vital tool for clear trading decisions.