
คำอธิบาย
ช่วยให้ผู้ใช้สามารถทำเครื่องหมายเวลาที่เปิดและปิดของช่วงการซื้อขายหลัก—เอเชีย, ลอนดอน, นิวยอร์ก และการปิดลอนดอน—ด้วยสี, สไตล์ และความหนาที่ปรับแต่งได้ ตัวบ่งชี้นี้วาดเส้นแนวโน้มสูงและต่ำสำหรับแต่ละช่วงเวลา ให้ข้อมูลเชิงลึกเกี่ยวกับพฤติกรรมตลาด ด้วยฟังก์ชันลากและวางที่ใช้งานง่าย (+ปุ่ม Alt) ทำให้การวาดเส้นสูงและต่ำของช่วงเวลาทำได้รวดเร็ว เหมาะสำหรับทั้งผู้เริ่มต้นและเทรดเดอร์ที่มีประสบการณ์ ตัวบ่งชี้นี้ช่วยให้ง่ายขึ้นในการนำทางความซับซ้อนของช่วงเวลาตลาดที่แตกต่างกัน
คุณสมบัติ
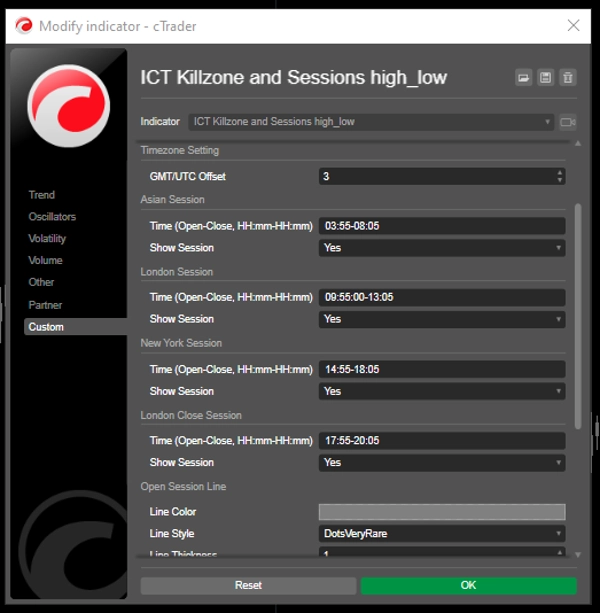
เวลาช่วงที่ปรับแต่งได้: ผู้ใช้สามารถกำหนดเวลาเปิดและปิดสำหรับช่วงการซื้อขายหลัก (เอเชีย, ลอนดอน, นิวยอร์ก และการปิดลอนดอน) เพื่อการแสดงผลที่เหมาะสมกับกลยุทธ์การซื้อขายของตน
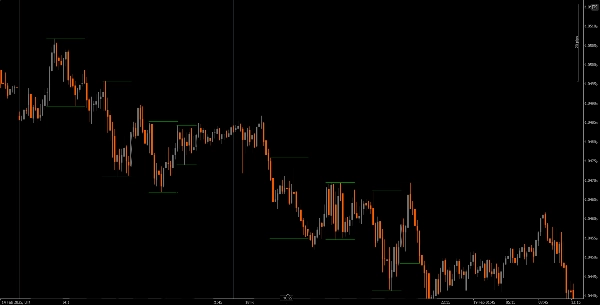
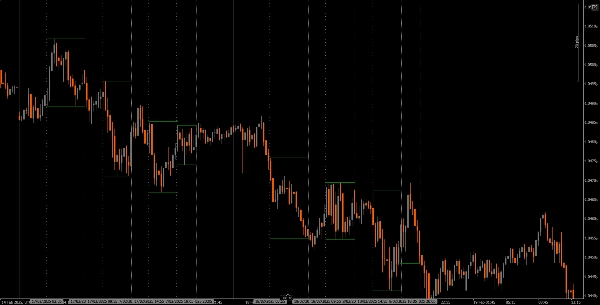
เส้นแนวตั้งแบบไดนามิก: ตัวบ่งชี้จะวาดเส้นแนวตั้งที่เวลาเปิดและปิดของช่วงเวลา ทำให้ง่ายต่อการระบุเหตุการณ์สำคัญของตลาดได้อย่างรวดเร็ว
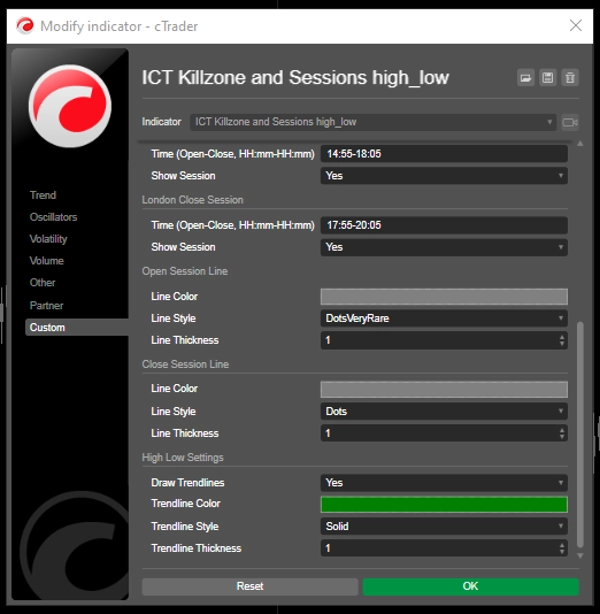
การแสดงเส้นแนวโน้ม: สามารถวาดเส้นแนวโน้มสูงและต่ำโดยอัตโนมัติสำหรับแต่ละช่วงเวลา ช่วยให้เทรดเดอร์เห็นระดับแนวรับและแนวต้านที่เป็นไปได้ตามการเคลื่อนไหวของราคาช่วงเวลานั้น
ลากและวางที่ใช้งานง่าย (+ปุ่ม Alt): ฟังก์ชันลากและวาง (+ปุ่ม Alt) ช่วยให้เทรดเดอร์เลือกช่วงเวลาที่ต้องการวิเคราะห์ได้อย่างง่ายดาย เพิ่มประสบการณ์การใช้งานโดยรวม
ป้ายชื่อช่วงเวลา: ตัวเลือกในการแสดงป้ายชื่อข้างเส้นแนวโน้มช่วงเวลาเพิ่มความชัดเจน ช่วยให้เทรดเดอร์ระบุช่วงเวลาที่กำลังวิเคราะห์ได้อย่างรวดเร็ว
การปรับเขตเวลา: ผู้ใช้สามารถตั้งค่าออฟเซ็ต GMT/UTC เพื่อให้เวลาช่วงเวลาถูกแสดงอย่างถูกต้องตามเขตเวลาท้องถิ่นของตน
บทแนะนำ
การติดตั้ง: ดาวน์โหลดและติดตั้งตัวบ่งชี้ The ICT Killzone and Sessions high_low บนแพลตฟอร์ม cAlgo ของคุณ
การตั้งค่า: เปิดการตั้งค่าเพื่อปรับแต่งเวลาช่วง, สี, สไตล์เส้น และความหนาตามความชอบของคุณ
การใช้ตัวบ่งชี้: คลิกและลาก (+ ปุ่ม Alt) บนแผนภูมิเพื่อสร้างสี่เหลี่ยมที่ครอบคลุมช่วงเวลาที่คุณต้องการวิเคราะห์ ตัวบ่งชี้จะวาดเส้นแนวตั้งและเส้นแนวโน้มสำหรับช่วงเวลาที่ระบุโดยอัตโนมัติ
การวิเคราะห์: สังเกตเส้นช่วงเวลาและเส้นแนวโน้มขณะทำการซื้อขาย ใช้ข้อมูลนี้เพื่อระบุระดับแนวรับและแนวต้านที่เป็นไปได้ตามพลวัตของช่วงเวลา
เครื่องมือเสริมที่แนะนำ
cTrader: แพลตฟอร์มพื้นเมืองสำหรับ cAlgo ที่ให้ประสบการณ์ที่ราบรื่นในการใช้และปรับแต่งตัวบ่งชี้
เครื่องมือวิเคราะห์ตลาด: รวมตัวบ่งชี้นี้กับเครื่องมือวิเคราะห์ตลาด เช่น ค่าเฉลี่ยเคลื่อนที่หรือออสซิลเลเตอร์ เพื่อเพิ่มประสิทธิภาพกลยุทธ์การซื้อขายของคุณ
เครื่องมือบริหารความเสี่ยง: ใช้เครื่องคิดขนาดตำแหน่งและเครื่องมือหยุดขาดทุนเพื่อจัดการความเสี่ยงอย่างมีประสิทธิภาพขณะทำการซื้อขาย
โดยการผสานตัวบ่งชี้ The ICT Killzone and Sessions high_low กับเครื่องมือเหล่านี้ เทรดเดอร์สามารถปรับปรุงการวิเคราะห์ตลาดและเพิ่มโอกาสในการประสบความสำเร็จในการนำทางความซับซ้อนของช่วงเวลาการซื้อขายที่แตกต่างกัน
สรุป
A drag-and-drop (+Alt Key) feature allows quick selection of specific time ranges for analysis. Optional session labels clarify which session is being viewed. Timezone adjustments via GMT/UTC offset ensure session times align with the trader’s local time zone.
Designed for use on the cAlgo platform, this tool supports enhanced market analysis when combined with other market analysis and risk management tools. It assists traders in navigating the complexities of different market sessions by providing clear visual cues and trendline insights.
รีวิวจากลูกค้า
5 | 40 % | |
4 | 20 % | |
3 | 0 % | |
2 | 0 % | |
1 | 40 % |


