
Descrizione
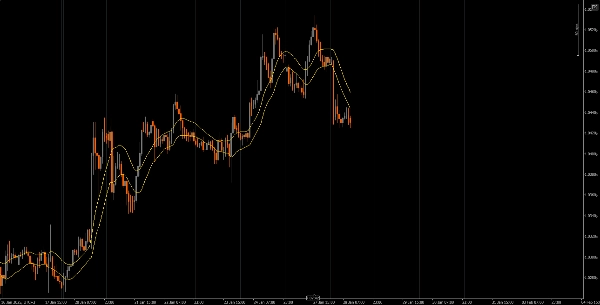
Medie mobili personalizzabili (MA) su un grafico, utilizzando diversi tipi di MA (Semplice, Ponderata, Esponenziale) e fonti di dati di prezzo (Chiusura, Apertura, Massimo, Minimo)
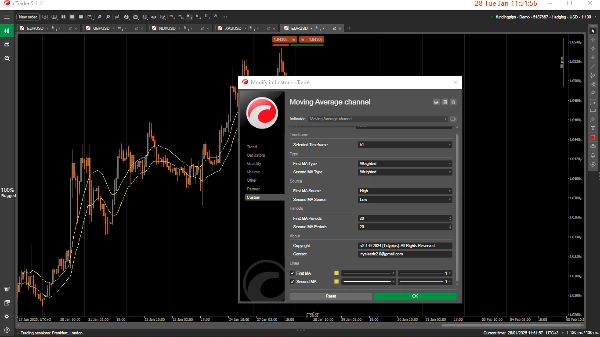
L'Indicatore WMA e SMA offre flessibilità nella visualizzazione delle medie mobili basate su parametri definiti dall'utente. Supporta tre tipi di medie mobili: Semplice (SMA), Ponderata (WMA) e Esponenziale (EMA). L'utente può applicare queste medie a varie fonti di dati come Chiusura, Apertura, Massimo, Minimo, o valori calcolati come Mediana, Tipico e Prezzi Ponderati.
Questo strumento ti permette anche di selezionare l'intervallo di tempo per cui l'indicatore è attivo, assicurandoti di concentrarti su periodi di dati specifici senza sovraccaricare i tuoi grafici con informazioni non necessarie.
Dai un'occhiata ad altri indicatori utili che ho pubblicato. Se trovi utile questo o uno qualsiasi dei miei altri indicatori, considera di supportare il mio lavoro acquistando o donando. Il tuo supporto non solo mi aiuta a continuare a sviluppare e migliorare questi strumenti, ma garantisce anche che io possa continuare a creare nuovi indicatori preziosi per migliorare la tua esperienza di trading. Grazie per il tuo continuo supporto!
https://buymeacoffee.com/tidypips


