คำอธิบาย
LogicLadder Pivots – เครื่องมือสแกนโครงสร้างตลาดขั้นสูงและรูปแบบ
ปลดล็อกโครงสร้างที่ซ่อนอยู่ของตลาดด้วย LogicLadder Pivots
ตัวชี้วัด LogicLadder Pivots เป็นเครื่องมือวิเคราะห์ราคาแบบมืออาชีพที่ออกแบบมาเพื่อช่วยเทรดเดอร์ในการมองเห็นโครงสร้างตลาด ระบุแนวโน้ม และตรวจจับรูปแบบกลับตัวที่มีความน่าจะเป็นสูงโดยอัตโนมัติ โดยการผสมผสานตรรกะ ZigZag แบบคลาสสิกกับการตรวจสอบหลายกรอบเวลาขั้นสูง เครื่องมือนี้ทำหน้าที่เป็นนักวิเคราะห์ตลาดส่วนตัวของคุณ ช่วยให้กราฟของคุณสะอาดในขณะที่แจ้งเตือนคุณเกี่ยวกับการเคลื่อนไหวของราคาที่สำคัญ
🚀 คุณสมบัติหลัก
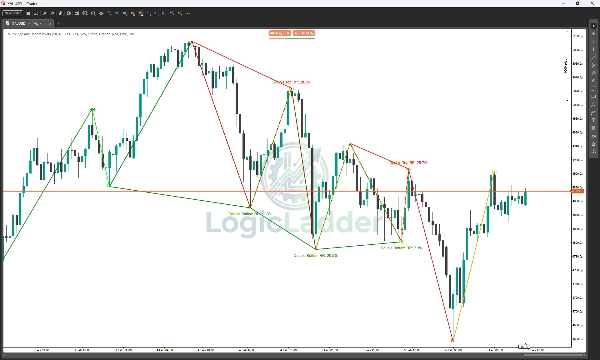
- โครงสร้างตลาดอัตโนมัติ: ทำการติดป้าย Higher Highs (HH), Lower Highs (LH), Higher Lows (HL) และ Lower Lows (LL) โดยอัตโนมัติ ช่วยให้คุณอ่านแนวโน้มปัจจุบันทันที
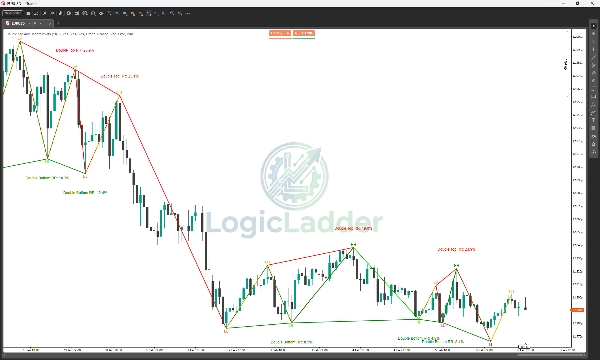
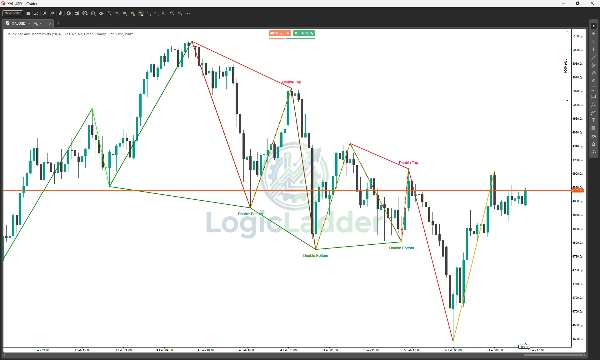
- การตรวจจับรูปแบบอัจฉริยะ: สแกนหา Double Top และ Double Bottom แบบเรียลไทม์ ไม่เพียงแต่ค้นหารูปแบบเท่านั้น แต่ยังกรองตามอัตราส่วน Risk-to-Reward (RR) ที่คำนวณได้ เพื่อให้คุณเห็นเฉพาะการตั้งค่าที่ใช้งานได้จริงเท่านั้น
- การแจ้งเตือนหลายกรอบเวลา (MTF): ตรวจสอบกรอบเวลาที่สูงกว่า (เช่น H4 หรือ Daily) ขณะเทรดในกรอบเวลาที่ต่ำกว่า ตัวชี้วัดจะแจ้งเตือนเมื่อเกิดจุด pivot สำคัญในกรอบเวลาที่คุณเฝ้าดู เพื่อให้แน่ใจว่าคุณจะไม่เทรดสวนกับแนวโน้มหลัก
- แผงสถิติแบบโต้ตอบ: แดชบอร์ดบนกราฟที่สะอาดแสดงสถานะปัจจุบันของการตรวจจับรูปแบบ (กำลังสแกน, ตรวจพบ Double Top ฯลฯ)
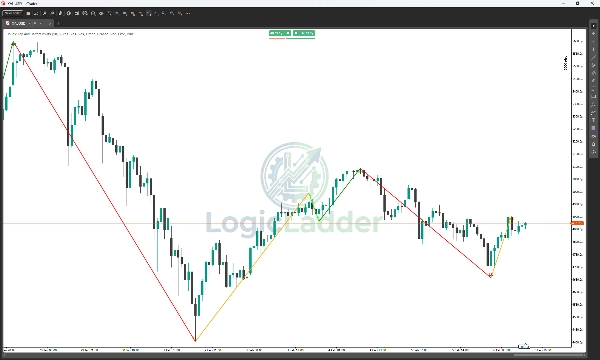
- การแสดงผล ZigZag: วาดเส้นแนวโน้มที่ชัดเจนและปรับแต่งได้ ช่วยตัดเสียงรบกวนและช่วยให้คุณมุ่งเน้นที่การแกว่งราคาที่สำคัญ
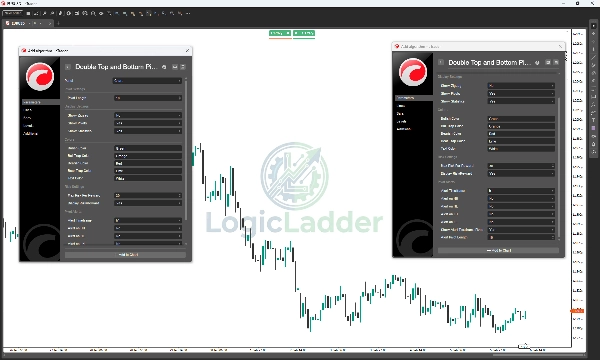
- ปรับแต่งได้เต็มที่: ปรับแต่งทุกแง่มุมของตัวชี้วัดให้เหมาะกับสไตล์การเทรดของคุณ ปรับความไวของ pivot (Length), เปลี่ยนสีสำหรับโครงสร้าง Bullish/Bearish และเปิดปิดองค์ประกอบภาพที่แตกต่างกันได้
🎨 คู่มือภาพและกลยุทธ์สี
ระบบ LogicLadder ใช้รหัสสี 4 สีเฉพาะเพื่อบอกเล่าเรื่องราวของโครงสร้างตลาดทันที นี่คือวิธีอ่าน "บันได":
1. 🟢 สีเขียว (ขาขึ้น - แข็งแกร่ง)
- มันคืออะไร: ใช้สำหรับ Higher Highs (HH).
- หมายความว่าอย่างไร: ผู้ซื้อควบคุมเต็มที่ ตลาดกำลังทำจุดสูงใหม่
- การดำเนินการ: มองหาโอกาสซื้อหรือถือสถานะซื้อที่มีอยู่
2. 🔴 สีแดง (ขาลง - แข็งแกร่ง)
- มันคืออะไร: ใช้สำหรับ Lower Lows (LL).
- หมายความว่าอย่างไร: ผู้ขายควบคุมเต็มที่ ตลาดกำลังตกลงสู่จุดต่ำใหม่
- การดำเนินการ: มองหาโอกาสขายหรือถือสถานะขายที่มีอยู่
3. 🟠 สีส้ม (กับดักกระทิง - อ่อนแอ)
- มันคืออะไร: ใช้สำหรับ Lower Highs (LH).
- หมายความว่าอย่างไร: ผู้ซื้อพยายามดันราคาขึ้นแต่ไม่สามารถทำลายจุดสูงก่อนหน้าได้ นี่คือ "กับดักกระทิง"—ผู้ซื้อที่เข้าช้าโดนจับขังเมื่อโมเมนตัมลดลง
- การดำเนินการ: สัญญาณเตือน! หากคุณถือสถานะซื้อ ควรพิจารณาทำกำไร ระวังการกลับตัวของแนวโน้มลง
4. 🟢 สีมะนาว (กับดักหมี - แข็งแกร่ง)
- มันคืออะไร: ใช้สำหรับ Higher Lows (HL).
- หมายความว่าอย่างไร: ผู้ขายพยายามดันราคาลงแต่ไม่สามารถทำลายจุดต่ำก่อนหน้าได้ นี่คือ "กับดักหมี"—ผู้ขายที่เข้าช้าถูกจับขังเมื่อแนวรับยังคงอยู่
- การดำเนินการ: สัญญาณโอกาส! มักบ่งชี้ถึงการเริ่มต้นของแนวโน้มขาขึ้นใหม่ รอสัญญาณเข้าเพื่อเปิดสถานะซื้อ
📉 วิธีเทรด "บันได"
- โหมดขาขึ้น: คุณต้องการเห็นรูปแบบของ สีเขียว (HH) เชื่อมต่อกับ สีมะนาว (HL) ซึ่งยืนยันบันไดที่กำลังขึ้นอย่างแข็งแรง
- โหมดขาลง: คุณต้องการเห็นรูปแบบของ สีแดง (LL) เชื่อมต่อกับ สีส้ม (LH) ซึ่งยืนยันบันไดที่กำลังตกอย่างรวดเร็ว
- การตรวจจับการกลับตัว:
-
- จุดสูงสุดที่เป็นไปได้: หากคุณเห็น สีเขียว (HH) ตามด้วยทันทีด้วย สีส้ม (LH) แนวโน้มขาขึ้นกำลังสูญเสียพลังงาน
- จุดต่ำสุดที่เป็นไปได้: หากคุณเห็น สีแดง (LL) ตามด้วยทันทีด้วย สีมะนาว (HL) แรงกดดันในการขายหมดลง
💡 วิธีการทำงาน
- การวิเคราะห์ Pivot: ตัวชี้วัดวิเคราะห์ช่วงเวลาย้อนหลังที่ผู้ใช้กำหนด (ค่าเริ่มต้น: 10 แท่ง) เพื่อระบุจุดสูงและต่ำที่สำคัญ
- ตรรกะแนวโน้ม: เชื่อมต่อจุดเหล่านี้เพื่อแสดงภาพ "บันได" ของราคา—แสดงให้คุณเห็นอย่างชัดเจนเมื่อแนวโน้มกำลังเปลี่ยนโครงสร้างหรือเคารพแนวรับ/แนวต้าน
- การยืนยันการกลับตัว: เมื่อการเคลื่อนไหวของราคาสร้างรูปแบบ "W" (Double Bottom) หรือ "M" (Double Top) ที่ตรงตามเกณฑ์ความเสี่ยง/ผลตอบแทนของคุณ ตัวชี้วัดจะวาดรูปแบบบนกราฟและอัปเดตแผงสถานะ
🔔 การแจ้งเตือนและการแจ้งข่าว
รับข้อมูลโดยไม่ต้องจ้องหน้าจอ LogicLadder Pivots มีระบบแจ้งเตือนที่แข็งแกร่ง:
- บันทึกการแจ้งเตือน: ข้อความรายละเอียดถูกพิมพ์ลงในบันทึก cTrader เมื่อเกิดรูปแบบหรือ pivot
- การตรวจสอบ MTF: รับการแจ้งเตือนเมื่อเกิด Pivot High หรือ Low โครงสร้างในกรอบเวลาการแจ้งเตือนที่คุณเลือก (เช่น รับการแจ้งเตือน Pivot Low 4 ชั่วโมงขณะเทรดสเกลบนกราฟ 5 นาที)
⚙️ พารามิเตอร์
- ความยาว Pivot: ความไวของการตรวจจับการแกว่ง
- การเลื่อนป้ายชื่อ: ปรับระยะห่างของป้ายข้อความจากไส้เทียนเพื่อการมองเห็นที่ดีขึ้น
- ความเสี่ยงสูงสุดต่อผลตอบแทน: กรองรูปแบบตามประสิทธิภาพ (ค่าเริ่มต้น: 30%)
- กรอบเวลาแจ้งเตือน: เลือกกรอบเวลาที่สองเพื่อตรวจสอบ
- การตั้งค่าภาพ: ควบคุมเต็มที่เกี่ยวกับสีสำหรับการเคลื่อนไหวแบบ Bullish, Bearish และ Trap
สรุป
The indicator detects Double Top and Double Bottom reversal patterns in real-time, filtering them by a calculated Risk-to-Reward ratio to highlight the most actionable setups. It supports alerts for pivot formations on higher timeframes while trading on lower ones, helping users align trades with major trends.
A customizable on-chart stats panel displays the current pattern detection status, and clear ZigZag trend lines visualize significant price swings. Users can adjust pivot sensitivity, label positioning, and color schemes for bullish, bearish, and trap moves to fit their trading style.
The tool employs a four-color system to represent market conditions: green for strong bullish moves (HH), red for strong bearish moves (LL), orange for bull traps (LH), and lime for bear traps (HL). This visual guide aids in spotting trend continuations and potential reversals. Alerts include detailed log messages and MTF notifications to keep traders informed.