
คำอธิบาย
⚡ คุณสมบัติหลัก
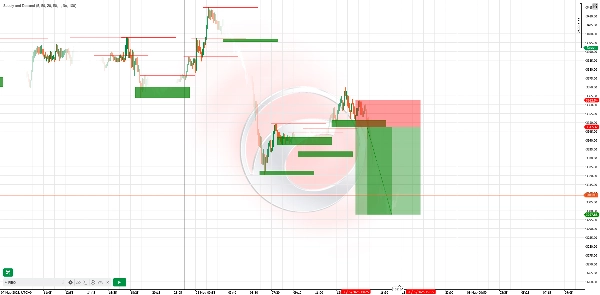
- การตรวจจับโซนแบบไดนามิก
-
- ตรวจจับจุดสูง/ต่ำแบบสวิงโดยอัตโนมัติและวาดโซนอุปทาน (แนวต้าน) & อุปสงค์ (แนวรับ) แบบเรียลไทม์
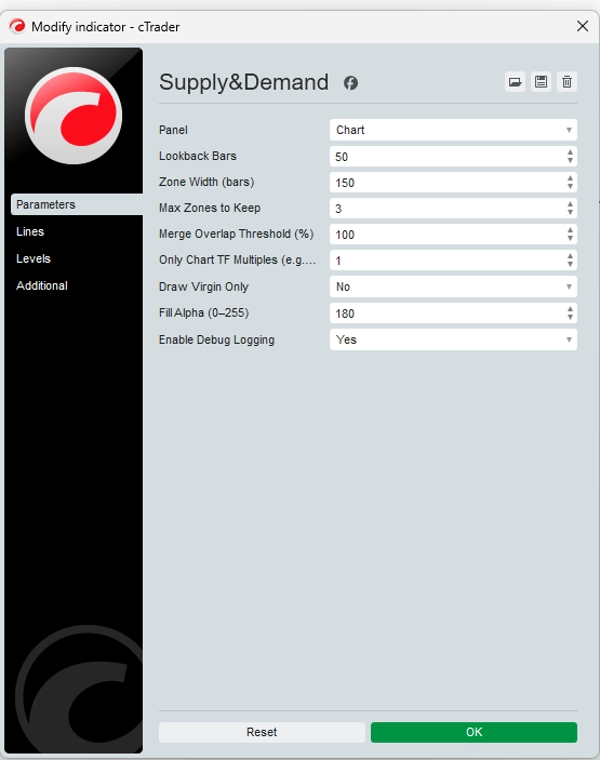
- พารามิเตอร์การย้อนดูและความกว้างของโซนที่ปรับแต่งได้ช่วยให้คุณปรับความไวให้เหมาะกับตลาดหรือกรอบเวลาที่ต้องการ
- การเน้นโซนเวอร์จิ้น
-
- โซน “เวอร์จิ้น” ใหม่ (ที่ราคายังไม่เคยสัมผัส) จะถูกเน้นให้เห็นชัดเจน—เทรดในจุดที่สถาบันทิ้งคำสั่งไว้
- สามารถเลือกซ่อนโซนที่ถูกสัมผัสแล้วเพื่อให้กราฟของคุณไม่รก
- การกรองหลายกรอบเวลา
-
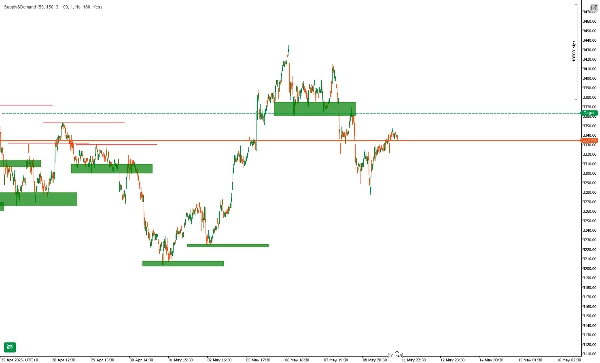
- แสดงเฉพาะโซนที่สอดคล้องกับพหุคูณกรอบเวลาของกราฟคุณ (เช่น แสดงโซนรายวันบนกราฟ 1 ชั่วโมง)
- ดูการรวมตัวของอุปทาน/อุปสงค์ในกรอบเวลาที่สูงกว่ากับการตั้งค่าในกรอบเวลาภายในวันได้อย่างรวดเร็ว
- ไม่รีเพนท์และไม่หน่วงเวลา
-
- โซนจะถูกตรึงไว้เมื่อวาดแล้ว—ไม่มีเส้นหายหรือเลื่อนหลังจากราคาขยับ
- ความน่าเชื่อถือที่ผ่านการทดสอบย้อนหลัง: โซนยังคงอยู่คงที่ ทำให้คุณมั่นใจในการวิเคราะห์ประวัติศาสตร์
- การแจ้งเตือนและบันทึกแบบกำหนดเอง
-
- รับการแจ้งเตือนป๊อปอัพหรืออีเมลเมื่อราคาก้าวเข้าสู่หรือทะลุโซน
- บันทึกดีบักอย่างละเอียดแสดงการสร้างโซน การข้ามซ้อนทับ และการสัมผัสโซน
🚀 วิธีการทำงาน
- การตรวจจับจุดหมุน: ตัวชี้วัดจะสแกนแต่ละแท่งใหม่เพื่อหาจุดสูงสุด (อุปทาน) และจุดต่ำสุด (อุปสงค์) ตามการย้อนดูที่คุณเลือก
- การสร้างโซน: สำหรับแต่ละจุดหมุน จะวาดโซนสี่เหลี่ยมผืนผ้าที่ยืดไปข้างหน้า—เน้นจุดที่สถาบันน่าจะวางคำสั่งจำกัด
- การกรองซ้อนทับ: โซนที่ซ้อนทับเกินเกณฑ์ของคุณจะถูกรวมกันหรือข้ามไป เพื่อให้เหลือเฉพาะพื้นที่ที่สำคัญที่สุด
- ตัวเลือกเฉพาะโซนเวอร์จิ้น: แสดงเฉพาะโซนที่ยังไม่ถูกสัมผัสเพื่อโฟกัสที่ระดับสถาบันที่สดใหม่ที่สุด
🎯 ตัวอย่างกลยุทธ์การเทรด
กลยุทธ์กรอบเวลาเข้าออกหยุดขาดทุนทำกำไร
การปฏิเสธโซน
H1
รอให้ราคาปรับตัวขึ้นเข้าสู่โซนอุปสงค์และแสดงแท่งเทียนขาลง (แบบ engulfing/pin bar) ในโซนอุปทาน
เลยขอบเขตโซนเล็กน้อย
สูงกว่าความสูงของโซน 1.5 เท่า
การรวมตัวของกรอบเวลา
M15 + H4
ระบุโซนอุปสงค์ H4 แล้วสลับไป M15 เพื่อหาการเคลื่อนไหวของแท่งเทียนขาขึ้นภายในโซนนั้น
ต่ำกว่าจุดต่ำของโซน H4
จุดสูงสุดสวิงถัดไปของ H4
การทะลุและทดสอบซ้ำ
H4
หลังจากราคาทะลุโซนอุปทาน รอการทดสอบซ้ำที่ด้านล่างของโซนและยืนยันสัญญาณขาลง
เหนือจุดบนสุดของโซน
จุดต่ำสุดล่าสุดของ H4
เคล็ดลับการใช้งาน: รวมกับ RSI หรือ MACD divergence ภายในโซนเพื่อสัญญาณที่มีความน่าจะเป็นสูงขึ้น
📈 ตัวอย่างในโลกจริง
- บน EURUSD H4 ตัวชี้วัดวาดโซนอุปสงค์ที่ 1.0950–1.0980
- ราคาปรับตัวลงเข้าสู่โซน พิมพ์แท่งเทียน bullish engulfing บน M15
- เข้าออเดอร์ที่ 1.0970 หยุดที่ 1.0945 (ต่ำกว่าโซน) เป้าหมายที่ 1.1040 (แนวต้าน H4 ถัดไป)
- ผลลัพธ์: +70 pips (~6.4× ความเสี่ยง)
⚠️ ข้อจำกัดความรับผิดชอบ
ตัวชี้วัดนี้เป็นเครื่องมือ—ไม่ใช่ระบบทำกำไรที่รับประกัน ผลงานในอดีตไม่รับประกันผลลัพธ์ในอนาคต ใช้การจัดการความเสี่ยงที่เหมาะสมเสมอ (เช่น สูงสุด 2% ต่อการเทรด) ทดสอบในบัญชีทดลองก่อน และผสมผสานกับการวิเคราะห์ของคุณเอง การเทรดมีความเสี่ยงที่จะขาดทุน; เทรดเฉพาะด้วยเงินทุนที่คุณสามารถเสียได้
สรุป
It supports multi-timeframe filtering, allowing users to display zones aligned with higher timeframe multiples on lower timeframe charts, facilitating confluence analysis. Zones are non-repainting and non-lagging; once drawn, they remain fixed, ensuring reliable historical analysis. Custom alerts notify users when price enters or breaks these zones, and detailed logs track zone creation and interactions.
The indicator operates by scanning each new bar for pivot highs and lows, constructing rectangular zones extending forward, and filtering overlapping zones to retain the most significant areas. It offers a “virgin-only” mode to focus on fresh institutional levels.
Example strategies include zone rejection, multi-timeframe confluence, and break & retest setups, often combined with RSI or MACD divergence for higher-probability signals. A real-world example on EURUSD H4 demonstrates entry, stop-loss, and take-profit placement based on demand zones and candlestick confirmation.
รีวิวจากลูกค้า
5 | 75 % | |
4 | 25 % | |
3 | 0 % | |
2 | 0 % | |
1 | 0 % |


