
Descrizione
ZigzagSR – Oscillazioni Zigzag Dinamiche con Supporto e Resistenza Automatizzati
Sblocca una struttura di mercato più chiara e zone di ingresso precise con ZigzagSR, un potente indicatore cTrader che:
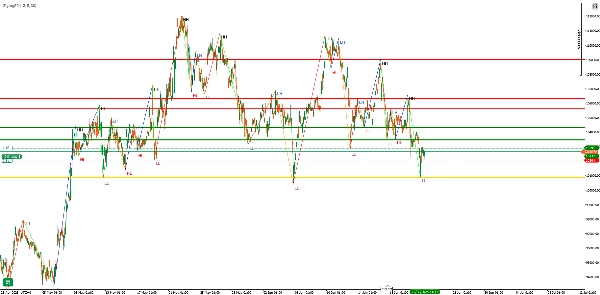
- Traccia oscillazioni zigzag non ridipingenti (massimi più alti, massimi più bassi, minimi più alti, minimi più bassi) in tempo reale
- Disegna automaticamente livelli dinamici di supporto e resistenza basati sulle oscillazioni pivot più recenti
- Etichetta ogni punto di oscillazione (“HH”, “LH”, “HL”, “LL”) per una chiarezza immediata del trend
Caratteristiche Principali
- Rilevamento Zigzag Adattivo
-
- Parametri configurabili Depth, Deviation e Backstep per affinare la sensibilità al rumore di mercato
- La logica non ridipingente garantisce che i segnali storici rimangano stabili una volta tracciati
- Livelli SR Automatici
-
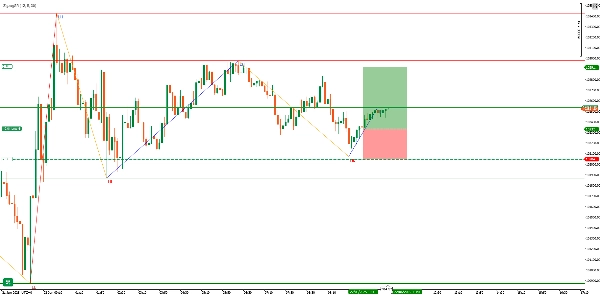
- Disegna una linea Pivot all’ultimo punto di oscillazione valido (linea dorata)
- Evidenzia fino agli ultimi tre massimi di Resistenza (linee rosse) e tre minimi di Supporto (linee verdi) prima del pivot
- Le linee si aggiornano senza soluzione di continuità man mano che si formano nuove oscillazioni, mantenendo il grafico ordinato
- Etichette Visive Chiare
-
- “HH” (Massimo più Alto) e “LH” (Massimo più Basso) per picchi ribassisti/più alti
- “HL” (Minimo più Alto) e “LL” (Minimo più Basso) per avvallamenti rialzisti/più bassi
- Segmenti zigzag codificati per colore:
-
- HH → Lime
- LH → Arancione
- HL → Blu
- LL → Rosso
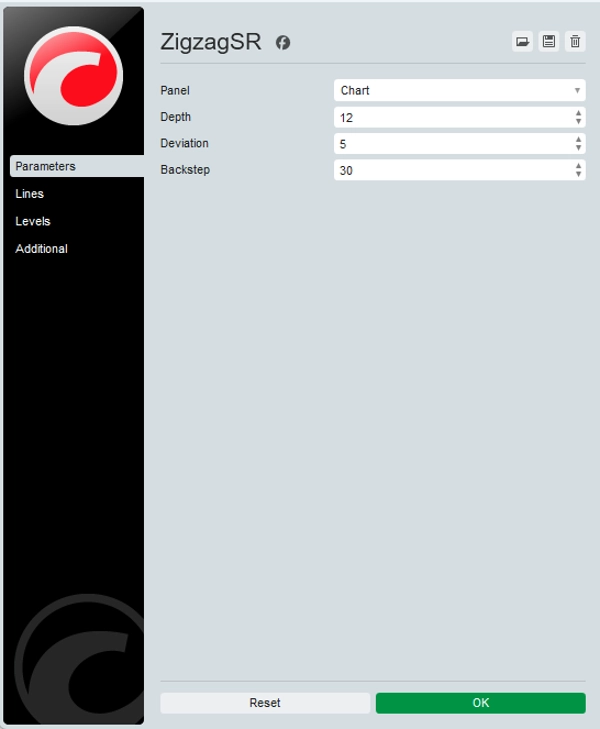
Input e Personalizzazione
ParametroPredefinitoDescrizione
Depth
12
Barre di look-back per identificare massimi/minimi locali
Deviation
5
Movimento minimo di prezzo (in tick) per contare come oscillazione
Backstep
3
Barre da “riavvolgere” per sopprimere falsi pivot
Suggerimento: Aumenta Depth e Deviation su timeframe più alti per filtrare il rumore; abbassali su M1/M5 per maggiore sensibilità.
Perché Usare ZigzagSR?
- Conferma del Trend: Distingui chiaramente oscillazioni impulsive da movimenti correttivi—ideale per trader swing e breakout.
- Zone di Ingresso SR: I livelli marcati automaticamente ti aiutano a individuare zone di ingresso, stop-loss e take-profit senza tracciare linee manualmente.
- Sviluppo di Strategie: Etichette e linee alimentano direttamente EAs/cBots o sistemi manuali—crea setup coerenti e basati su regole.
Come Funziona
- Mappatura Massimi/Minimi
-
- Scansiona le barre degli ultimi
Depthperiodi per segnalare estremi locali (_highMap&_lowMap).
- Scansiona le barre degli ultimi
- Costruzione delle Oscillazioni
-
- Alterna tra stati rialzisti e ribassisti, aggiungendo solo pivot significativi alla lista delle oscillazioni.
- Assegnazione Etichette
-
- Confronta ogni pivot con il precedente per etichettarlo come HH/LH o HL/LL.
- Disegno SR
-
- Identifica l’ultimo pivot come “linea pivot”, quindi traccia i tre massimi e minimi validi precedenti come resistenza/supporto.
- Rendering Zigzag
-
- Collega tutti i punti di oscillazione con linee di tendenza colorate e sovrappone etichette testuali leggermente spostate per chiarezza.
Casi d'Uso e Suggerimenti
- Swing Trading: Cavalca impulsi multi-barra—entra sui ritracciamenti verso la linea pivot, mira al prossimo livello SR.
- Conferma Breakout: Aspetta che il prezzo superi una linea di resistenza tracciata da ZigzagSR, poi conferma con volume o RSI.
- Sovrapposizione con Altri Indicatori: Combina con medie mobili, divergenze RSI o profili di volume per rafforzare i segnali.
Inizia in pochi secondi:
- Installa ZigzagSR dallo Store di cTrader.
- Applicalo su qualsiasi grafico—non sono necessarie librerie esterne.
- Regola i tre parametri di input in base al tuo timeframe e stile di strategia preferiti.
Eleva la tua analisi grafica con la struttura delle oscillazioni in tempo reale e supporto e resistenza dinamici—prova ZigzagSR oggi!
Riepilogo
Recensioni dei clienti
5 | 33 % | |
4 | 67 % | |
3 | 0 % | |
2 | 0 % | |
1 | 0 % |


