

Descripción
🧠 Indicador RSI Avanzado – Análisis de Momentum de Precisión
Obtenga una comprensión más profunda de las tendencias del mercado con un RSI más inteligente
El Indicador RSI Avanzado es una poderosa evolución de la herramienta RSI clásica, desarrollada para traders que valoran la precisión y el filtrado inteligente de señales. Con un suavizado algorítmico avanzado, zonas adaptativas y detección integrada de divergencias, esta herramienta proporciona un análisis de momentum refinado para todos los mercados y marcos temporales.
🔍 Características clave:
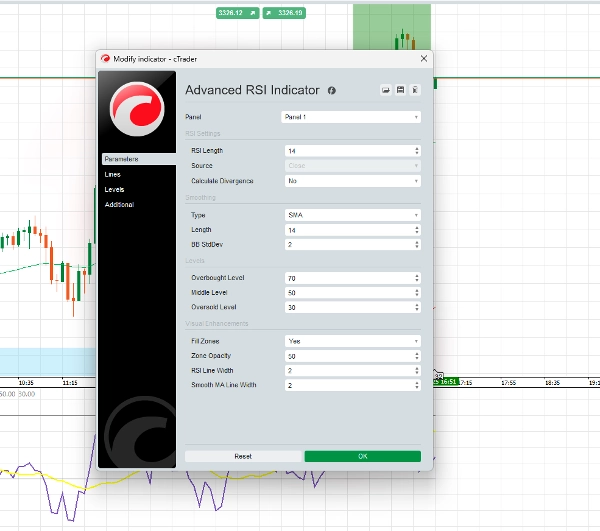
✅ Curva RSI Suavizada
Reduce movimientos erráticos y señales falsas para obtener una visión más clara de las tendencias del mercado.
✅ Zonas de Señal Adaptativas
Va más allá de los niveles tradicionales 70/30 con umbrales dinámicos que responden a la volatilidad del mercado.
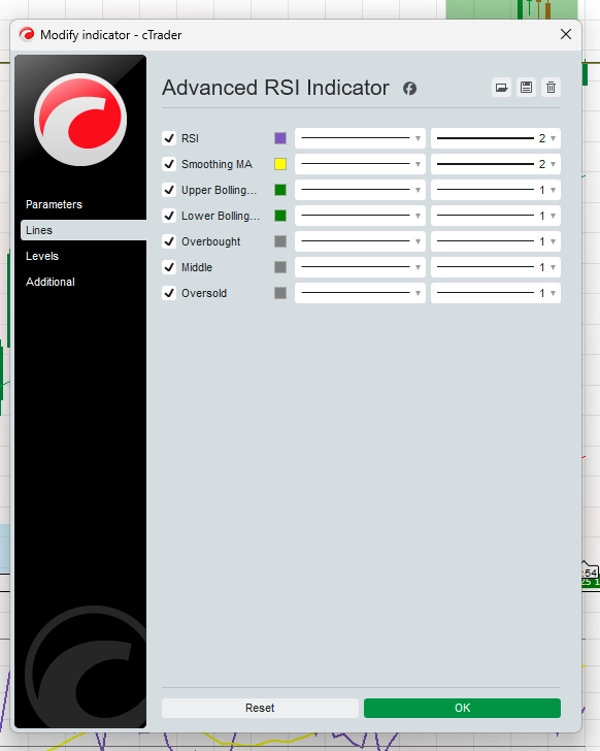
✅ Zonas de Momentum Codificadas por Color
Evalúe rápidamente el momentum alcista o bajista con un diseño visual intuitivo.
✅ Alertas de Divergencia
Destaca configuraciones de divergencia alcista y bajista para apoyar la toma de decisiones estratégicas.
✅ Sistema de Alertas Personalizado
Configure alertas para cruces de niveles RSI y señales de divergencia para que nunca pierda momentos clave.
✅ Multi-Activo, Multi-Marco Temporal
Optimizado para uso en forex, criptomonedas, acciones, índices y más — desde gráficos M1 hasta diarios.
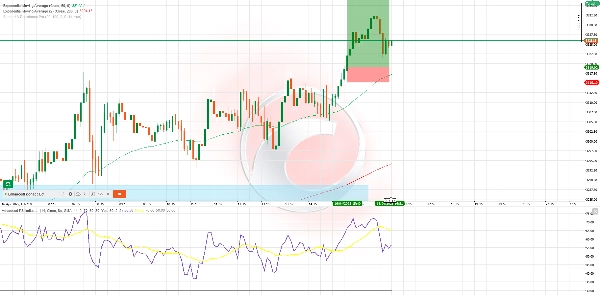
⚙️ Ejemplo de Estrategia – RSI Wave Ride
Mejor para: operaciones swing en H1 y H4
Indicadores usados: RSI Avanzado, 50 EMA, 200 EMA
Ejemplo de compra:
- El precio está por encima de las EMA 50 y 200
- El RSI cae por debajo de 40 y comienza a subir
- Aparece el color de momentum alcista
- (Opcional) Se detecta divergencia alcista
- Entrada: cierre de vela por encima de la señal
- SL: Por debajo del último mínimo del swing
- TP: 1.5x–2x el riesgo o resistencia reciente
Ejemplo de venta:
- El precio está por debajo de las EMA 50 y 200
- El RSI sube por encima de 60, luego comienza a descender
- El color de momentum bajista confirma la dirección
- (Opcional) La divergencia bajista añade fuerza
- Entrada: cierre de vela de confirmación
- SL: Por encima del último máximo del swing
- TP: 1.5x–2x el riesgo o soporte reciente
💬 Por qué los traders eligen esta herramienta:
- Fácil de usar, pero potente
- Señales que no se repintan
- Probado en los principales mercados
- Puede usarse solo o junto con otras estrategias
Resumen
Valoraciones de clientes
5 | 100 % | |
4 | 0 % | |
3 | 0 % | |
2 | 0 % | |
1 | 0 % |


![Logotipo de "[Stellar Strategies] Market Session Ultimate"](https://cdn.ctrader.com/image/webp/61ffd537-0125-4246-9e72-42eca1791d64_28232)


