
Açıklama
⚡ Temel Özellikler
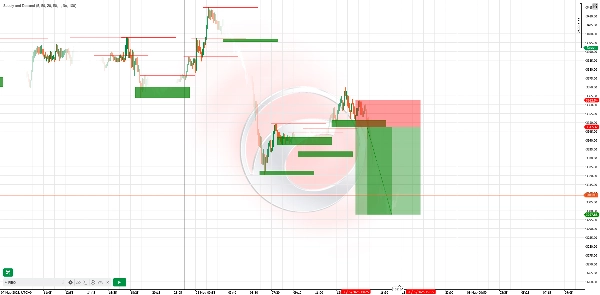
- Dinamik Bölge Tespiti
-
- Salınım yüksek/düşüklerini otomatik algılar ve gerçek zamanlı olarak arz (direnç) & talep (destek) bölgeleri çizer.
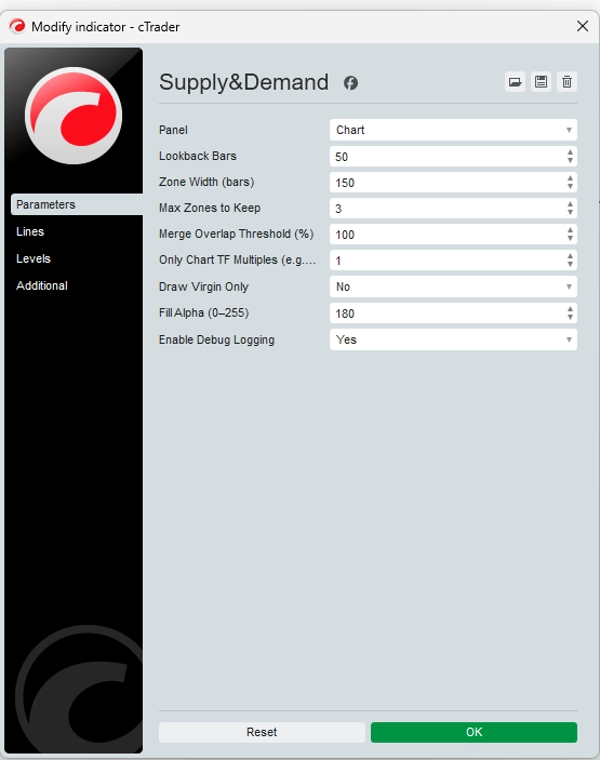
- Yapılandırılabilir geriye dönük ve bölge genişliği parametreleri, herhangi bir piyasa veya zaman dilimi için hassasiyeti uyarlamanıza olanak tanır.
- Virgin Bölge Vurgulama
-
- Fiyat tarafından hiç dokunulmamış taze “virgin” bölgeler görsel olarak vurgulanır—kurumların emir bıraktığı yerlerde işlem yapın.
- İsteğe bağlı olarak, grafik temizliğini korumak için dokunulmuş bölgeleri gizleyin.
- Çoklu Zaman Dilimi Filtreleme
-
- Grafiğinizin zaman dilimi katlarıyla uyumlu olan bölgeleri çizin (örneğin, 1 saatlik grafikte günlük bölgeleri gösterin).
- Yüksek zaman dilimi arz/talep bölgelerinin iç günlük kurulumunuzla örtüşmesini hızlıca görün.
- Yeniden Çizilmeyen & Gecikmeyen
-
- Bölgeler çizildikten sonra sabittir—fiyat hareketinden sonra kaybolan veya kayan çizgiler yoktur.
- Geriye dönük test edilmiş güvenilirlik: bölgeler statik kalır, geçmiş analizde size güven verir.
- Özel Uyarılar & Kayıt
-
- Fiyat bir bölgeye girdiğinde veya kırdığında açılır pencere veya e-posta uyarıları alın.
- Detaylı hata ayıklama kaydı, bölge oluşturma, atlanan örtüşmeler ve bölge dokunuşlarını gösterir.
🚀 Nasıl Çalışır
- Pivot Tespiti: Gösterge, seçtiğiniz geriye dönük süreye göre her yeni barı pivot yüksekleri (arz) ve pivot düşükleri (talep) için tarar.
- Bölge Oluşumu: Her pivot için, kurumların muhtemelen limit emirleri yerleştirdiği yerleri vurgulayan ileriye doğru uzanan dikdörtgen bir bölge çizilir.
- Örtüşme Filtreleme: Eşik değerinizin ötesinde örtüşen bölgeler birleşir veya atlanır, böylece sadece en önemli alanlar kalır.
- Sadece Virgin Seçeneği: En taze kurumsal seviyelere odaklanmak için sadece dokunulmamış bölgeleri görünür tutun.
🎯 Örnek Ticaret Stratejileri
StratejiZaman DilimiGirişStop‑LossKar Al
Bölge Reddetme
H1
Fiyatın bir talep bölgesine yükselmesini ve arz bölgesinde ayı mum çubuğu (yutan/çivili mum) göstermesini bekleyin
Bölge sınırının hemen ötesinde
1.5× bölge yüksekliği
Zaman Dilimi Uyumu
M15 + H4
H4 talep bölgesini belirleyin, sonra M15’e geçip o bölge içinde yükseliş momentumu mumunu bulun
H4 bölge altının altında
Sonraki H4 salınım yüksekliği
Kırılma ve Yeniden Test
H4
Fiyat bir arz bölgesini kırdıktan sonra, bölgenin alt yüzeyini yeniden test etmesini ve ayı teyidi bekleyin
Bölge üstünün üzerinde
Son H4 düşük
Kullanım İpucu: Bölgeler içinde daha yüksek olasılıklı sinyaller için RSI veya MACD uyumsuzluğu ile birleştirin.
📈 Gerçek Dünya Örneği
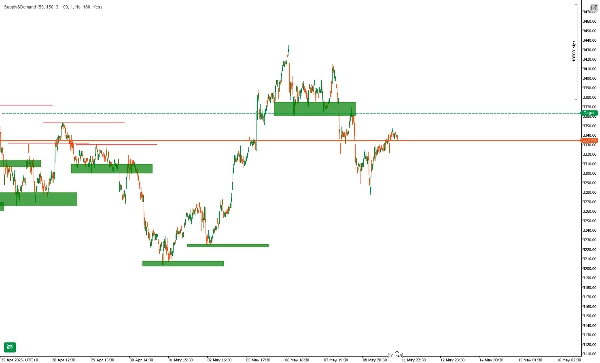
- EURUSD H4’te, gösterge 1.0950–1.0980 arasında bir talep bölgesi çizer.
- Fiyat bölgeye iner, M15’te yükseliş yutan mum çubuğu oluşur.
- Giriş 1.0970, stop 1.0945 (bölgenin altında), hedef 1.1040 (sonraki H4 direnç).
- Sonuç: +70 pip (~6.4× risk).
⚠️ Feragatname
Bu gösterge bir araçtır—garantili bir kar sistemi değildir. Geçmiş performans gelecekteki sonuçları garanti etmez. Her zaman uygun risk yönetimi kullanın (örneğin işlem başına maksimum %2), önce demo hesapta test edin ve kendi analizinizle birleştirin. Ticaret kayıp riski taşır; sadece kaybetmeyi göze alabileceğiniz sermaye ile işlem yapın.
Özet
It supports multi-timeframe filtering, allowing users to display zones aligned with higher timeframe multiples on lower timeframe charts, facilitating confluence analysis. Zones are non-repainting and non-lagging; once drawn, they remain fixed, ensuring reliable historical analysis. Custom alerts notify users when price enters or breaks these zones, and detailed logs track zone creation and interactions.
The indicator operates by scanning each new bar for pivot highs and lows, constructing rectangular zones extending forward, and filtering overlapping zones to retain the most significant areas. It offers a “virgin-only” mode to focus on fresh institutional levels.
Example strategies include zone rejection, multi-timeframe confluence, and break & retest setups, often combined with RSI or MACD divergence for higher-probability signals. A real-world example on EURUSD H4 demonstrates entry, stop-loss, and take-profit placement based on demand zones and candlestick confirmation.
Müşteri değerlendirmeleri
5 | 75 % | |
4 | 25 % | |
3 | 0 % | |
2 | 0 % | |
1 | 0 % |


