
Chandelier Exit
Gösterge
5 satın almalar
Sürüm 1.0, Oct 2025
Windows, Mac
4.3
Değerlendirmeler: 3
Açıklama
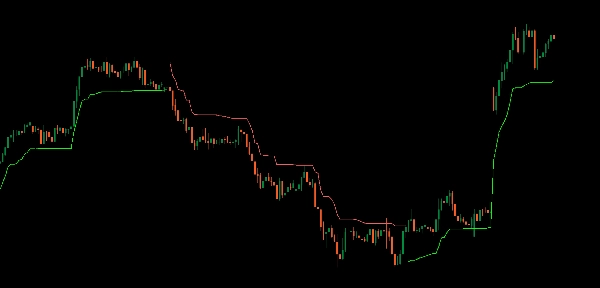
Tanıtıyoruz Chandelier Exit göstergesini, ticaret çıkışlarını hassasiyet ve güvenle optimize etmek için nihai aracınız.
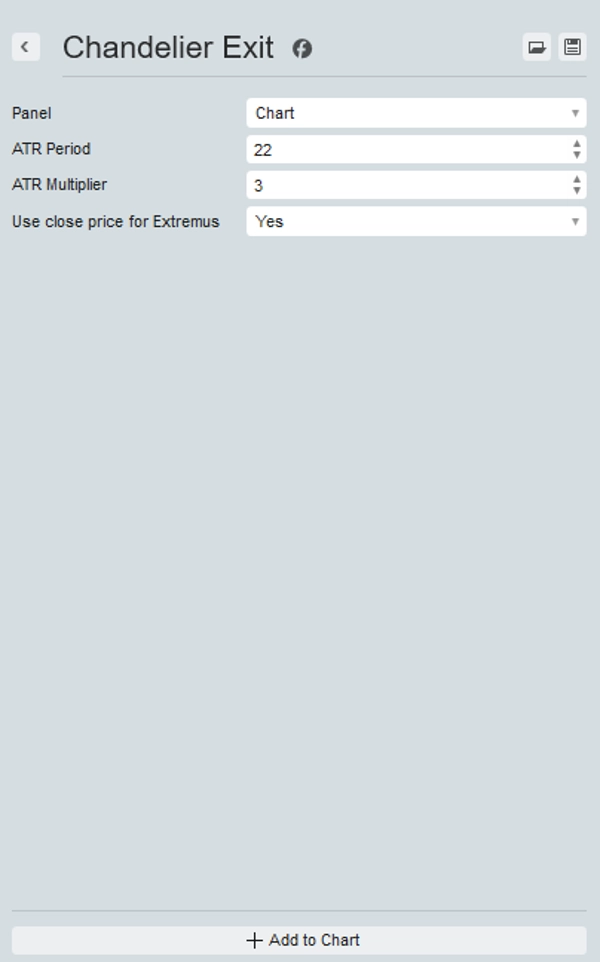
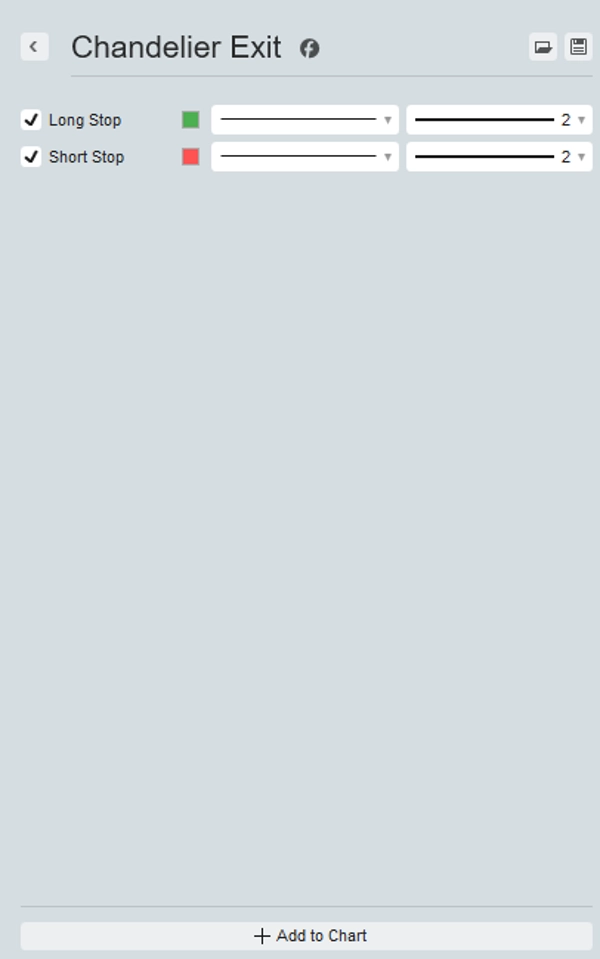
Bu gösterge, en yüksek zirve ve ATR'ye dayalı olarak dinamik şekilde stop-loss noktalarını hesaplar ve gerçek zamanlı olarak grafiğinizde net görsel ipuçları sağlar.
Kârınızı güvence altına almanıza ve piyasa dönüşlerine karşı koruma sağlamanıza yardımcı olmak için tasarlanan Chandelier Exit, sizi her zaman bir adım önde tutar.
Güvenilir çıkış sinyalleriyle stratejisini geliştirmek isteyen tüccarlar için mükemmel olan bu gösterge, riski yönetmek için basit ve görsel bir yaklaşım sunar. Ticaret araç setinizi yükseltin ve kazançlarınızı Chandelier Exit ile güvence altına alın.
Özet
YZ özeti
The Chandelier Exit indicator dynamically calculates stop-loss levels based on the highest high price and the Average True Range (ATR). It provides real-time visual cues on trading charts to help traders optimize exit points, lock in profits, and protect against market reversals. Suitable for various markets including Forex, cryptocurrencies, stocks, commodities, and indices, it supports symbols such as BTCUSD, EURUSD, GBPUSD, XAUUSD, NAS100, and USDJPY. The indicator offers a straightforward, visual method for managing risk and enhancing trading strategies by signaling reliable exit points.
Gösterge profili
Müşteri değerlendirmeleri
4.3
Değerlendirmeler: 3
5 | 33 % | |
4 | 67 % | |
3 | 0 % | |
2 | 0 % | |
1 | 0 % |
Müşteri değerlendirmeleri
October 9, 2025
Decent tool for testing if the trader wants it keeps trade control closer to the plan. It works best as support, not a final decision maker. The best use is 1 percent risk per trade, BE after 1R and partials near 1.5R. incorrect settings can give a false sense of safety.
October 8, 2025
October 8, 2025
Useful extra check for traders who care about risk before entries. It gives value around risk management, but incorrect settings can give a false sense of safety. I would check 30 trades and compare DD before and after the tool, aiming for less than 3 percent monthly DD. It is useful when the trader already respects stops and sizing.
Tartışma
SSS
BTCUSD
Forex
Signal
Indices
EURUSD
Commodities
GBPUSD
NZDUSD
Prop
Scalping
Crypto
Stocks
XAUUSD
NAS100
ATR
USDJPY
cTrader Store üzerinden erişilebilen işlem botları, göstergeler ve eklentiler gibi ürünler, üçüncü taraf sağlayıcılar tarafından sağlanır ve yalnızca bilgilendirme ve teknik erişim amaçlarıyla sunulur. cTrader Store bir broker değildir ve yatırım tavsiyesi, kişisel öneriler vermez veya gelecekteki performansı garanti etmez.


Fiyat
Başlangıç 25/09/2025
25
Satışlar
315
Ücretsiz yüklemeler