
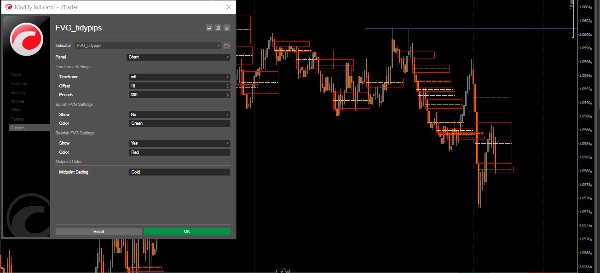
FVG_tidypips
Gösterge
13 satın almalar
Sürüm 1.0, Nov 2024
Windows, Mac
4.3
Değerlendirmeler: 3

Açıklama
Bu Adil Değer Boşluğu (FVG) Göstergesi, tüccarların fiyat dengesizliklerini tanımlamasına yardımcı olan teknik analiz aracıdır.
Özellikler:
- Boğa ve/veya ayı boşluklarının görünürlüğünü açma/kapatma
- Kolay görselleştirme için renk kodlu kutular gösterir (varsayılan: boğalar için yeşil, ayılar için kırmızı, orta nokta seviyeleri için altın)
- Grafik karmaşasını azaltmak için ayarlanabilir geriye dönük dönem
- Daha iyi görselleştirme için yapılandırılabilir kutu uzatma ayarı (ofset)
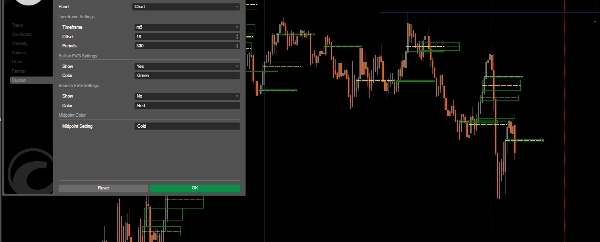
Parametreler:
- Zaman dilimi: FVG'leri görüntülemek için tercih ettiğiniz zaman dilimini seçin
- Ofset: FVG kutularının yatay uzantısını ayarlayın (3-500)
- Dönemler: Tarihsel FVG hesaplaması için geriye dönük dönemi ayarlayın
- Boğa/Ayı FVG'lerini Göster
- Renkler: boğa FVG'leri, ayı FVG'leri ve orta nokta çizgileri için renkleri özelleştirin
Ticaret Uygulamaları:
- Destek ve Direnç: FVG'ler genellikle güçlü destek/direnç seviyeleri olarak işlev görür
- Fiyat Mıknatısları: Doldurulmamış boşluklar fiyat hareketini çeker (DOL)
- Piyasa Yapısı: Potansiyel dönüş bölgelerini ve ilgi devam noktalarını tanımlamaya yardımcı olur
- Emir Bloğu Analizi: Kurumsal ticaret bölgelerini tespit edin
En İyi Uygulama Yöntemleri:
- Diğer teknik analiz araçlarıyla birlikte kullanın.
- Daha yüksek zaman dilimleri daha anlamlı FVG'ler üretir, daha düşük zaman dilimleri ise daha yüksek zaman dilimi Yönsel Eğilim ile kullanılır
- Fiyatın FVG bölgelerine dönerken nasıl tepki verdiğini izleyin
- Orta nokta çizgisine dikkat edin çünkü genellikle bir fiyat mıknatısı olarak hizmet eder
Yayınladığım diğer faydalı göstergelere göz atın. Bu göstergeyi veya diğer göstergelerimden herhangi birini faydalı bulursanız, çalışmalarımı satın alarak veya bağış yaparak desteklemeyi düşünün. Desteğiniz, bu araçları geliştirmeye ve iyileştirmeye devam etmemi sağlamakla kalmaz, aynı zamanda ticaret deneyiminizi geliştirmek için yeni, değerli göstergeler yaratmaya devam etmemi sağlar. Sürekli desteğiniz için teşekkür ederim!
https://buymeacoffee.com/tidypips
Özet
YZ özeti
The FVG_tidypips indicator is a technical analysis tool designed to identify Fair Value Gaps (FVGs), which represent price imbalances on trading charts. It visually highlights bullish and bearish gaps using color-coded boxes—green for bullish, red for bearish, and gold for midpoint levels—facilitating quick recognition of potential support and resistance zones. Users can toggle the visibility of bullish and/or bearish gaps, adjust the lookback period to manage chart clutter, and configure the horizontal extension (offset) of the FVG boxes for clearer visualization.
Key parameters include selecting the timeframe for FVG display, setting the offset range (3–500), defining the lookback period for historical gap calculation, and customizing colors for different gap types and midpoint lines. The indicator supports trading applications such as identifying strong support/resistance levels, spotting price magnets where unfilled gaps attract price action, analyzing market structure for potential reversal or continuation zones, and detecting institutional order block areas.
Best practices recommend using this indicator alongside other technical tools, focusing on higher timeframes for more significant FVGs, and monitoring price reactions when revisiting FVG zones. The midpoint line is noted as an important price magnet. This tool is applicable across various markets, including commodities like gold (XAUUSD).
Gösterge profili
Müşteri değerlendirmeleri
4.3
Değerlendirmeler: 3
5 | 33 % | |
4 | 67 % | |
3 | 0 % | |
2 | 0 % | |
1 | 0 % |
Müşteri değerlendirmeleri
November 22, 2024
Good idea with limits for traders who use ICT or SMC concepts. It gives value around smart money style analysis, but zones still need manual validation. A good sample is 20 FVG or order block reactions, with messy 0.705 areas skipped. The zone is more convincing when structure and risk both make sense.
November 21, 2024
November 21, 2024
Small but practical edge for smart money style analysis. it adds structure around liquidity, gaps and market shifts, especially when used for mapping zones before entries. For SMC logic, I trust zones more when 0.5 mitigation, BOS and liquidity sweep line up. The zone is more convincing when structure and risk both make sense.
Tartışma
SSS
Commodities
XAUUSD
cTrader Store üzerinden erişilebilen işlem botları, göstergeler ve eklentiler gibi ürünler, üçüncü taraf sağlayıcılar tarafından sağlanır ve yalnızca bilgilendirme ve teknik erişim amaçlarıyla sunulur. cTrader Store bir broker değildir ve yatırım tavsiyesi, kişisel öneriler vermez veya gelecekteki performansı garanti etmez.
Bu oluşturanın diğer ürünleri


Fiyat
15
Satışlar
4.63K
Ücretsiz yüklemeler