
Açıklama
Bu araç, kullanıcıların günlük gibi bir analiz zaman dilimi belirlemesine ve özelleştirilebilir renkler, stiller ve kalınlıklarla grafiklerinde yüksek ve düşük seviyeleri çizmesine olanak tanır. Birden fazla önceki günü destekleyerek önemli fiyat hareketi bölgelerinin kolayca tanımlanmasını sağlar. Gösterge ayrıca, tarihsel fiyat verilerine dayalı bilinçli kararlar vermeye yardımcı olmak için isteğe bağlı etiketler içerir. Hem yeni başlayanlar hem de deneyimli tüccarlar için ideal olan bu araç, piyasa analizini ve ticaret stratejilerini geliştirir.
Özellikler
Özelleştirilebilir Zaman Dilimi: Kullanıcılar, ticaret stratejilerine uygun kişiselleştirilmiş görselleştirme için önceki yüksek ve düşükleri analiz etmek üzere belirli bir zaman dilimi (örneğin günlük) seçebilirler.
Birden Fazla Önceki Gün: Birden fazla önceki gün için yüksek ve düşük seviyeleri çizme yeteneği, önemli fiyat hareketi bölgelerinin kapsamlı bir görünümünü sağlar.
Dinamik Trend Çizgileri: Gösterge, önceki günün yüksek ve düşük seviyeleri için trend çizgileri çizer, böylece potansiyel dönüş bölgelerini kolayca tanımlamayı sağlar.
Etiketleme Seçenekleri: Kullanıcılar, mevcut yüksek ve düşük değerleri doğrudan grafik üzerinde göstermek için etiketleri etkinleştirebilir, bu da açıklık ve anlayışı artırır.
Görsel Özelleştirme: Tüccarlar, çizgi renklerini, stillerini ve kalınlıklarını tercihlerine göre özelleştirerek grafik okunabilirliğini artırabilirler.
Zaman Dilimi Kısıtlamaları: Gösterge, belirtilen minimum ve maksimum zaman dilimi ayarları içinde çalışmasını sağlar, böylece diğer zaman dilimleri arasında geçiş yaparken grafik karmaşasını azaltır.
Dikkat Edilmesi Gerekenler
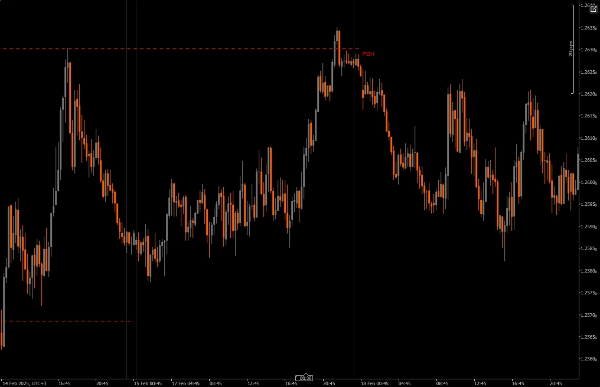
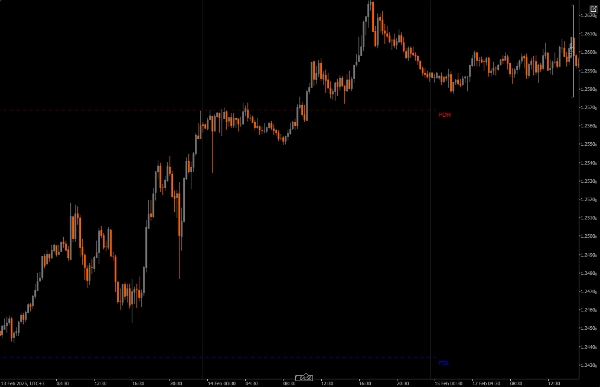
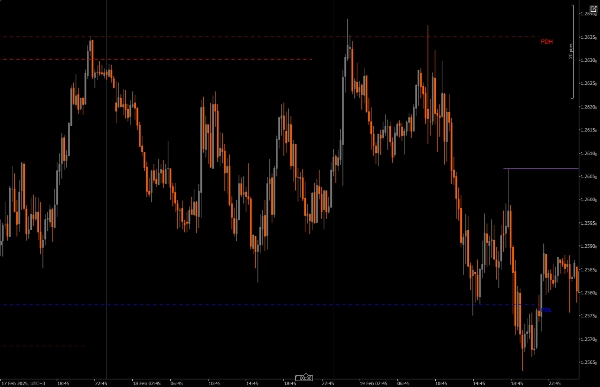
Piyasadaki PDH veya PDL, likidite çekimi (DOL) olarak kullanılabilir veya bir dönüşü çerçevelemek için kullanılabilir.
Dönüşler, yer değiştirme başarısız olduğunda PDH ve PDL’den çerçevelenebilir.
Fiyat, yukarıda veya aşağıda bir PD dizisini saygı gösterdiğinde ve günlük yüksek veya düşük seviyenin üzerinde yer değiştirme başarısız olduğunda, sonraki mum tahmin edilebilir.
Fiyatın önceki günün yüksek veya düşük seviyesine ulaşma olasılığı daha mı yüksek? PDH PDL kullanılırken likidite çekimi (DOL) olarak.
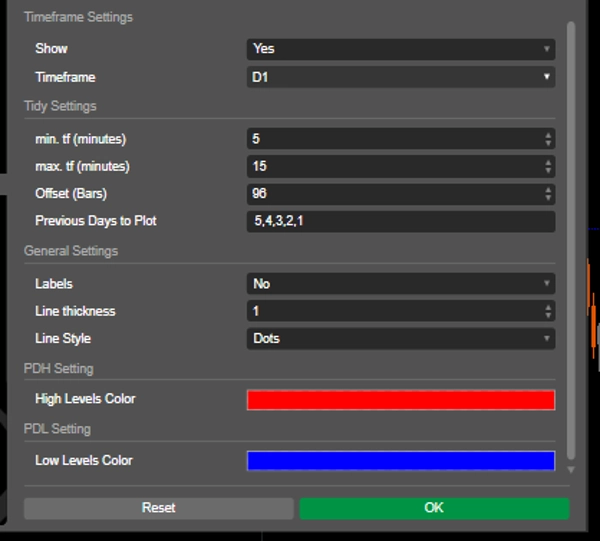
Kurulum: Daily Range Liquidity Zones (PDH PDL) göstergesini cAlgo platformunuza indirin ve kurun.
Ayar: Gösterge ayarlarını açın ve analiz için istediğiniz zaman dilimini, çizilecek önceki gün sayısını seçin ve çizgi rengi ve kalınlığı gibi görsel parametreleri özelleştirin.
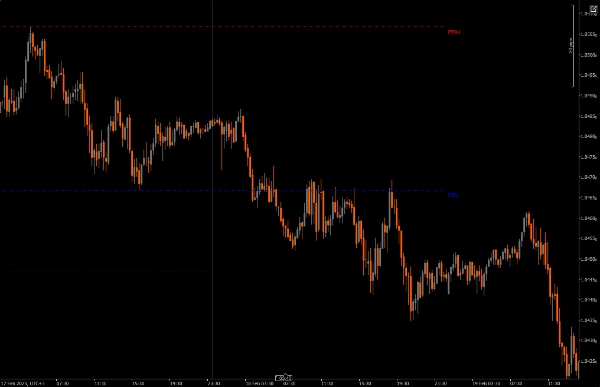
Göstergeyi Kullanma: Gösterge, belirtilen ayarlara göre önceki günün yüksek ve düşük seviyelerini otomatik olarak grafiğinizde çizecektir.
Analiz: Ticaret yaparken çizilen seviyeleri gözlemleyin. Bu seviyeleri potansiyel dönüşleri çerçevelemek ve bilinçli ticaret kararları vermek için kullanın.
Önerilen Yardımcı Araçlar
cTrader: cAlgo için yerel platform, göstergeleri kullanmak ve özelleştirmek için sorunsuz bir ortam sağlar.
Teknik Analiz Araçları: Bu göstergeleri Fair Value Gaps (FVG) ve Reversal Pattern Indicators (CRT) gibi diğer araçlarla birleştirerek ticaret stratejinizi ve piyasa analizini geliştirin.
Risk Yönetimi Araçları: Belirlenen yüksek ve düşük seviyeler çevresinde ticaret yaparken riski etkili bir şekilde yönetmek için pozisyon büyüklüğü hesaplayıcıları ve stop-loss araçlarını kullanın.
Daily Range Liquidity Zones (PDH PDL) göstergesini bu araçlarla entegre ederek, tüccarlar piyasa analizlerini geliştirebilir ve fiyat hareketlerinin karmaşıklıklarında başarı şanslarını artırabilirler.
Özet
Müşteri değerlendirmeleri
5 | 100 % | |
4 | 0 % | |
3 | 0 % | |
2 | 0 % | |
1 | 0 % |