الوصف
يتيح للمستخدمين تحديد أوقات فتح وإغلاق جلسات التداول الرئيسية — الآسيوية، لندن، نيويورك، وإغلاق لندن — بألوان وأنماط وسماكات قابلة للتخصيص. يرسم هذا المؤشر خطوط اتجاه عالية ومنخفضة لكل جلسة، مما يوفر رؤى حول سلوك السوق. مع وظيفة السحب والإفلات سهلة الاستخدام (+مفتاح Alt) يجعل رسم أعلى وأدنى الجلسات سريعًا. مثالي لكل من المتداولين المبتدئين وذوي الخبرة، يجعل هذا المؤشر التنقل في تعقيدات جلسات السوق المختلفة أسهل.
الميزات
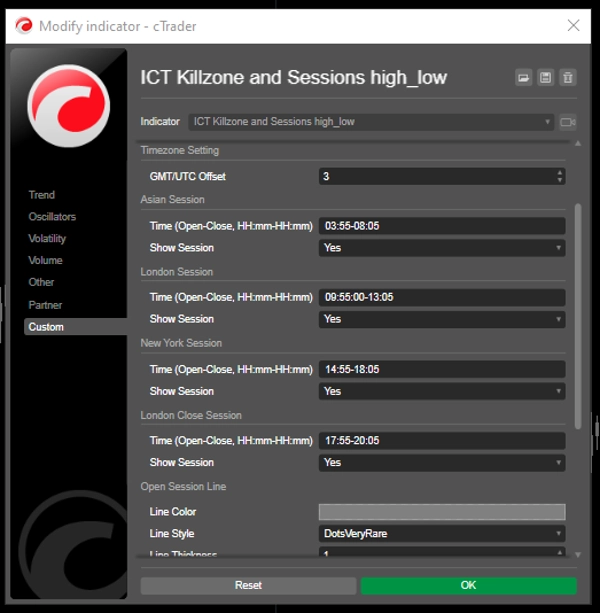
أوقات الجلسات القابلة للتخصيص: يمكن للمستخدمين تحديد أوقات فتح وإغلاق جلسات التداول الرئيسية (الآسيوية، لندن، نيويورك، وإغلاق لندن)، مما يسمح بتصور مخصص يتناسب مع استراتيجيات التداول الخاصة بهم.
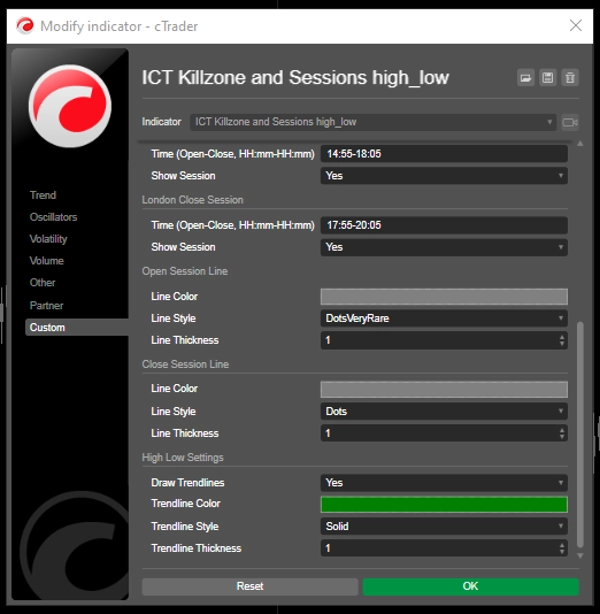
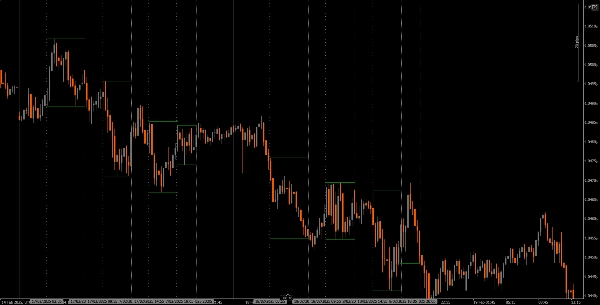
خطوط عمودية ديناميكية: يرسم المؤشر خطوطًا عمودية عند أوقات فتح وإغلاق الجلسة، مما يسهل التعرف على الأحداث الرئيسية في السوق بنظرة سريعة.
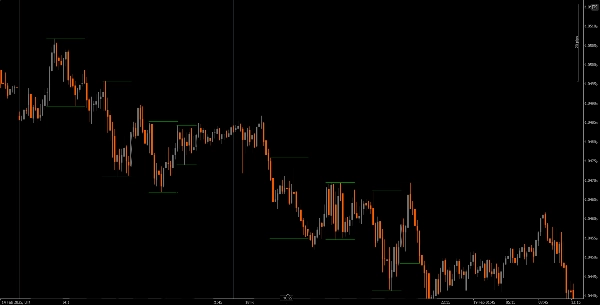
تصوير خطوط الاتجاه: يمكنه رسم خطوط اتجاه عالية ومنخفضة تلقائيًا لكل جلسة، مما يسمح للمتداولين برؤية مستويات الدعم والمقاومة المحتملة بناءً على حركة السعر في الجلسة.
سحب وإفلات سهل الاستخدام (+مفتاح Alt): تتيح وظيفة السحب والإفلات (+مفتاح Alt) للمتداولين اختيار نطاقات زمنية محددة للتحليل بسهولة، مما يعزز تجربة المستخدم بشكل عام.
تسميات الجلسات: خيار عرض التسميات بجانب خطوط اتجاه الجلسة يضيف وضوحًا، مما يساعد المتداولين على التعرف بسرعة على الجلسة التي يقومون بتحليلها.
تعديل المنطقة الزمنية: يمكن للمستخدمين ضبط تعويض GMT/UTC، مما يضمن تمثيل أوقات الجلسات بدقة وفقًا للمنطقة الزمنية المحلية الخاصة بهم.
الدليل التعليمي
التثبيت: قم بتنزيل وتثبيت مؤشر The ICT Killzone and Sessions high_low على منصة cAlgo الخاصة بك.
الإعداد: افتح الإعدادات لتخصيص أوقات الجلسات، الألوان، أنماط الخطوط، والسماكة وفقًا لتفضيلاتك.
استخدام المؤشر: انقر واسحب (+ مفتاح Alt) على الرسم البياني لإنشاء مستطيل يشمل النطاق الزمني الذي تريد تحليله. سيقوم المؤشر تلقائيًا برسم خطوط عمودية وخطوط اتجاه للجلسات المحددة.
التحليل: راقب خطوط الجلسة وخطوط الاتجاه أثناء التداول. استخدم هذه المعلومات لتحديد مستويات الدعم والمقاومة المحتملة بناءً على ديناميكيات الجلسة.
الأدوات المصاحبة الموصى بها
cTrader: المنصة الأصلية لـ cAlgo، توفر تجربة سلسة لاستخدام وتخصيص المؤشرات.
أدوات تحليل السوق: اجمع هذا المؤشر مع أدوات تحليل السوق، مثل المتوسطات المتحركة أو المذبذبات، لتعزيز استراتيجية التداول الخاصة بك.
أدوات إدارة المخاطر: استخدم حاسبات حجم المركز وأدوات وقف الخسارة لإدارة المخاطر بفعالية أثناء التداول.
من خلال دمج مؤشر The ICT Killzone and Sessions high_low مع هذه الأدوات، يمكن للمتداولين تحسين تحليل السوق وزيادة فرص نجاحهم في التنقل بين تعقيدات جلسات التداول المختلفة.
الملخص
A drag-and-drop (+Alt Key) feature allows quick selection of specific time ranges for analysis. Optional session labels clarify which session is being viewed. Timezone adjustments via GMT/UTC offset ensure session times align with the trader’s local time zone.
Designed for use on the cAlgo platform, this tool supports enhanced market analysis when combined with other market analysis and risk management tools. It assists traders in navigating the complexities of different market sessions by providing clear visual cues and trendline insights.
تقييمات العملاء
5 | 40 % | |
4 | 20 % | |
3 | 0 % | |
2 | 0 % | |
1 | 40 % |