

Deskripsi
Alat ini memungkinkan pengguna untuk menentukan kerangka waktu untuk analisis, seperti harian, dan memplot level tertinggi dan terendah pada grafik mereka dengan warna, gaya, dan ketebalan yang dapat disesuaikan. Ini mendukung beberapa hari sebelumnya, sehingga mudah untuk mengidentifikasi zona aksi harga yang signifikan. Indikator ini juga memiliki label opsional untuk kejelasan, membantu trader membuat keputusan yang tepat berdasarkan data harga historis. Ideal untuk trader pemula maupun berpengalaman, alat ini meningkatkan analisis pasar dan strategi perdagangan.
Fitur
Kerangka Waktu yang Dapat Disesuaikan: Pengguna dapat memilih kerangka waktu tertentu (misalnya, harian) untuk menganalisis harga tertinggi dan terendah sebelumnya, memungkinkan visualisasi yang disesuaikan sesuai strategi perdagangan mereka.
Beberapa Hari Sebelumnya: Kemampuan untuk memplot level tertinggi dan terendah untuk beberapa hari sebelumnya memberikan pandangan komprehensif tentang zona aksi harga yang signifikan.
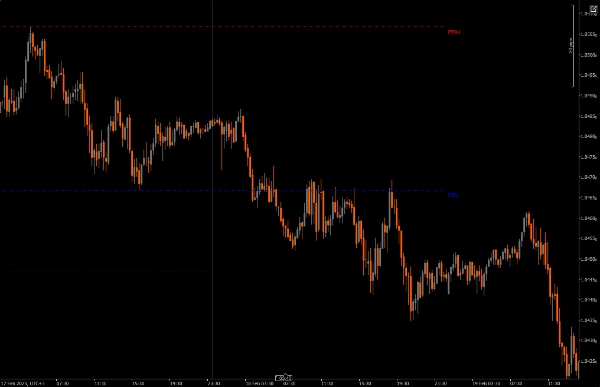
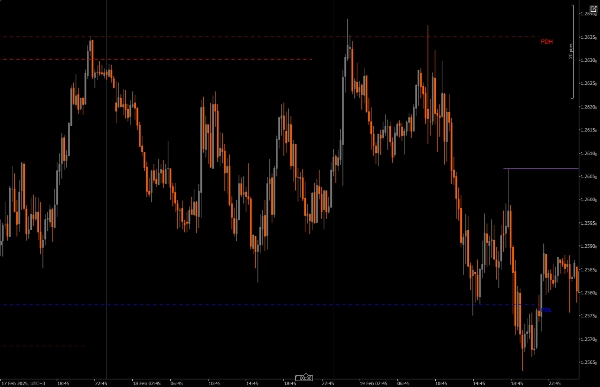
Garis Tren Dinamis: Indikator menggambar garis tren untuk harga tertinggi dan terendah hari sebelumnya, memudahkan identifikasi zona pembalikan potensial secara sekilas.
Opsi Pelabelan: Pengguna dapat mengaktifkan label untuk menampilkan nilai tertinggi dan terendah saat ini langsung pada grafik, meningkatkan kejelasan dan pemahaman.
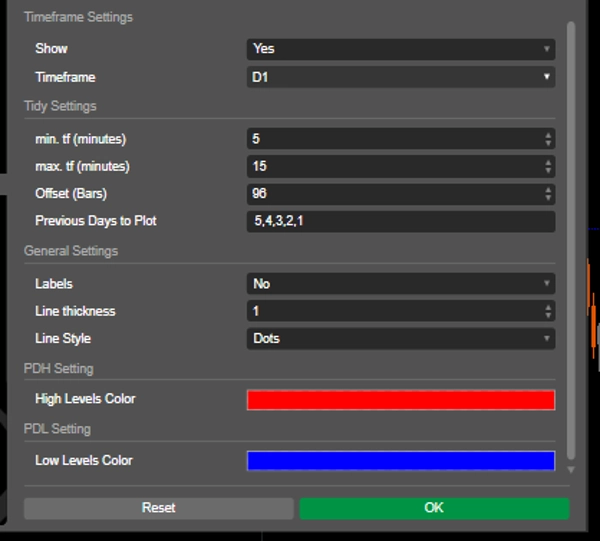
Kustomisasi Visual: Trader dapat menyesuaikan warna garis, gaya, dan ketebalan sesuai preferensi mereka dan meningkatkan keterbacaan grafik.
Pembatasan Kerangka Waktu: Indikator memastikan bahwa ia beroperasi hanya dalam pengaturan kerangka waktu minimum dan maksimum yang ditentukan, mengurangi kekacauan grafik saat beralih melalui kerangka waktu lain.
Hal yang Perlu Diperhatikan
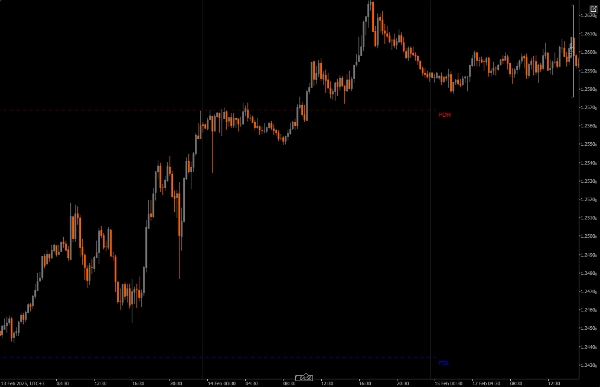
PDH atau PDL di pasar dapat digunakan sebagai draw on liquidity (DOL) atau digunakan untuk membingkai pembalikan.
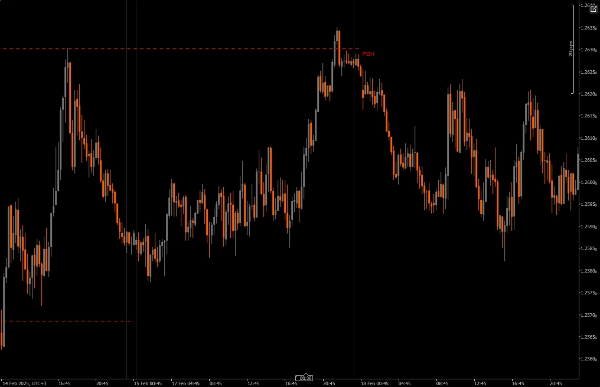
Pembalikan dapat dibingkai dari PDH dan PDL ketika terjadi kegagalan untuk menggantikan.
Ketika harga menghormati array PD di atas atau di bawah, gagal menggantikan di atas level tertinggi atau terendah Harian, lilin berikutnya dapat diantisipasi.
Apakah harga lebih mungkin mencapai harga tertinggi atau terendah hari sebelumnya? Saat menggunakan PDH PDL sebagai draw on liquidity (DOL)
Instalasi: Unduh dan pasang Daily Range Liquidity Zones (PDH PDL) di platform cAlgo Anda.
Pengaturan: Buka pengaturan indikator dan pilih kerangka waktu yang diinginkan untuk analisis, jumlah hari sebelumnya yang akan dipetakan, dan sesuaikan parameter visual seperti warna garis dan ketebalan.
Menggunakan Indikator: Indikator akan secara otomatis memplot level tertinggi dan terendah hari sebelumnya pada grafik Anda berdasarkan pengaturan yang ditentukan.
Analisis: Amati level yang dipetakan saat Anda berdagang. Gunakan level ini untuk membingkai potensi pembalikan, dan buat keputusan perdagangan yang tepat.
Alat Pendamping yang Direkomendasikan
cTrader: Platform asli untuk cAlgo, menyediakan lingkungan yang mulus untuk menggunakan dan menyesuaikan indikator.
Alat Analisis Teknis: Gabungkan indikator ini dengan alat lain seperti Fair Value Gaps (FVG) dan Reversal Pattern Indicators (CRT) untuk meningkatkan strategi perdagangan dan analisis pasar Anda.
Alat Manajemen Risiko: Gunakan kalkulator ukuran posisi dan alat stop-loss untuk mengelola risiko secara efektif saat berdagang di sekitar level tertinggi dan terendah yang diidentifikasi.
Dengan mengintegrasikan Daily Range Liquidity Zones (PDH PDL) dengan alat-alat ini, trader dapat meningkatkan analisis pasar mereka dan memperbaiki peluang keberhasilan dalam menavigasi kompleksitas aksi harga.
Ringkasan
Ulasan pelanggan
5 | 100 % | |
4 | 0 % | |
3 | 0 % | |
2 | 0 % | |
1 | 0 % |


