
Beschreibung
Der umfassende Leitfaden zur Ichimoku-Cloud-Analyse
Geschichte und Hintergrund
Der Ichimoku Kinko Hyo (oder Ichimoku-Cloud) wurde Ende der 1930er Jahre vom japanischen Journalisten Goichi Hosoda entwickelt. Nach jahrelanger Forschung und Backtesting mit einem Team von Assistenten veröffentlichte Hosoda seine Erkenntnisse 1969. Der Name „Ichimoku Kinko Hyo“ lässt sich mit „Ein-Blick-Gleichgewichtschart“ übersetzen, was seinen Zweck widerspiegelt: Händlern zu ermöglichen, mehrere Aspekte der Marktbewegung schnell in einer einzigen Ansicht zu erfassen.
Hosodas Innovation war bemerkenswert, da er dieses komplexe System Jahrzehnte vor der Verfügbarkeit von Computeranalysen entwickelte und alle Berechnungen von Hand durchführte. Was das Ichimoku-System einzigartig macht, ist sein ganzheitlicher Ansatz, der mehrere Zeitrahmen und Dimensionen der Marktanalyse in einem einheitlichen Rahmen integriert.
Die fünf Komponenten der Ichimoku-Cloud
Die Ichimoku-Cloud besteht aus fünf verschiedenen Linien, die jeweils spezifische Einblicke bieten:
1. Tenkan-sen (Umrechnungslinie)
- Berechnung: (Höchster Hoch + Niedrigster Tief) / 2 der letzten 9 Perioden
- Funktion: Repräsentiert das kurzfristige Marktmomentum
- Interpretation: Dient als dynamische Unterstützungs-/Widerstandsebene und Trendindikator
2. Kijun-sen (Basislinie)
- Berechnung: (Höchster Hoch + Niedrigster Tief) / 2 der letzten 26 Perioden
- Funktion: Repräsentiert das mittelfristige Marktmomentum
- Interpretation: Dient als stärkere Unterstützungs-/Widerstandsebene und kann als Trailing Stop verwendet werden
3. Senkou Span A (Leading Span A)
- Berechnung: (Tenkan-sen + Kijun-sen) / 2, 26 Perioden voraus geplottet
- Funktion: Bildet die vordere Kante der Wolke (Kumo)
- Interpretation: Prognostizierte Unterstützungs-/Widerstandsebene
4. Senkou Span B (Leading Span B)
- Berechnung: (Höchster Hoch + Niedrigster Tief) / 2 der letzten 52 Perioden, 26 Perioden voraus geplottet
- Funktion: Bildet die hintere Kante der Wolke (Kumo)
- Interpretation: Prognostizierte Unterstützungs-/Widerstandsebene
5. Chikou Span (Nachlaufende Linie)
- Berechnung: Aktueller Schlusskurs, 26 Perioden zurück geplottet
- Funktion: Bestätigt Trends und identifiziert potenzielle Umkehrpunkte
- Interpretation: Wenn über der Kursbewegung, bullisch; wenn darunter, bärisch
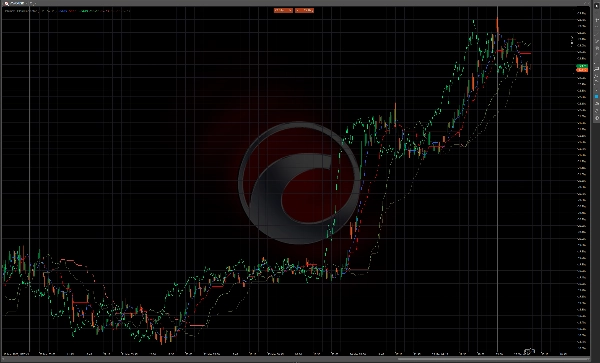
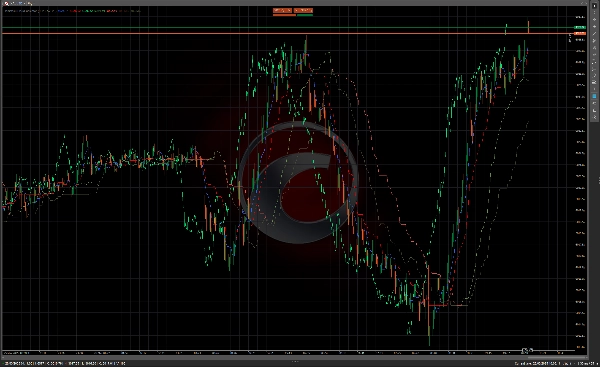
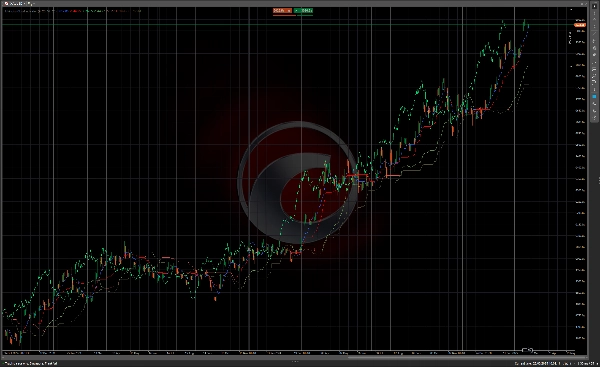
Der Kumo (Wolke)
Der Bereich zwischen Senkou Span A und Senkou Span B wird „Kumo“ oder Wolke genannt. Die Wolke stellt potenzielle Unterstützungs- und Widerstandszonen dar, und ihre Dicke zeigt die Marktvolatilität und die Stärke dieser Zonen an.
- Dicke Wolke: Starke Unterstützung/Widerstand, höhere Volatilität
- Dünne Wolke: Schwächere Unterstützung/Widerstand, geringere Volatilität
- Bullische Wolke: Senkou Span A über Senkou Span B (oft grün gefärbt)
- Bärische Wolke: Senkou Span B über Senkou Span A (oft rot gefärbt)
Handelsregeln und Signale
Trendbestimmung
- Kriterien für einen Aufwärtstrend:
-
- Der Kurs liegt über der Wolke
- Tenkan-sen liegt über Kijun-sen
- Chikou Span liegt über dem Kurs von vor 26 Perioden
- Senkou Span A steigt und liegt über Senkou Span B (bullische Wolke)
- Kriterien für einen Abwärtstrend:
-
- Der Kurs liegt unter der Wolke
- Tenkan-sen liegt unter Kijun-sen
- Chikou Span liegt unter dem Kurs von vor 26 Perioden
- Senkou Span A fällt und liegt unter Senkou Span B (bärische Wolke)
- Neutraler/Seitwärtsmarkt:
-
- Der Kurs befindet sich innerhalb der Wolke
- Tenkan-sen und Kijun-sen sind flach oder kreuzen sich häufig
Einstiegssignale
Bullische Einstiegssignale
- TK-Kreuz (Tenkan/Kijun-Kreuz):
-
- Tenkan-sen kreuzt über Kijun-sen
- Am effektivsten, wenn der Kurs über der Wolke liegt
- Stärkeres Signal bei bullischer Wolke
- Kumo-Ausbruch:
-
- Der Kurs bricht über die Wolke aus, nachdem er darunter oder innerhalb war
- Stärkeres Signal, wenn die Wolke voraus bullisch ist (Senkou Span A > Senkou Span B)
- Chikou-Span-Bestätigung:
-
- Chikou Span kreuzt über den Kurs von vor 26 Perioden
- Kein Widerstand voraus für Chikou Span
Bärische Einstiegssignale
- TK-Kreuz (bärisch):
-
- Tenkan-sen kreuzt unter Kijun-sen
- Am effektivsten, wenn der Kurs unter der Wolke liegt
- Stärkeres Signal bei bärischer Wolke
- Kumo-Ausbruch (bärisch):
-
- Der Kurs bricht unter die Wolke aus, nachdem er darüber oder innerhalb war
- Stärkeres Signal, wenn die Wolke voraus bärisch ist (Senkou Span B > Senkou Span A)
- Chikou-Span-Bestätigung (bärisch):
-
- Chikou Span kreuzt unter den Kurs von vor 26 Perioden
- Keine Unterstützung voraus für Chikou Span
Ausstiegssignale
- Trendwende: Wenn die Kriterien für den entgegengesetzten Trend zu erscheinen beginnen
- TK-Kreuz: Wenn Tenkan-sen Kijun-sen in die entgegengesetzte Richtung kreuzt
- Wolkentouch: Wenn der Kurs die gegenüberliegende Seite der Wolke berührt
- Chikou-Span-Warnung: Wenn Chikou Span historische Kursniveaus erreicht
Unterstützungs- und Widerstandsniveaus
- Unmittelbare Unterstützung/Widerstand: Tenkan-sen und Kijun-sen
- Mittelfristige Unterstützung/Widerstand: Die Wolke (stärker an flachen Abschnitten)
- Kumo-Twist: Wenn Senkou Span A und B sich kreuzen und potenzielle Umkehrpunkte schaffen
Fortgeschrittene Ichimoku-Techniken
1. Kumo-Twist (Wolken-Twist)
Ein Kumo-Twist tritt auf, wenn Senkou Span A und B sich kreuzen und einen potenziellen Umkehrpunkt 26 Perioden in der Zukunft schaffen. Händler nutzen dies oft als Frühwarnsignal für mögliche Trendänderungen.
2. Analyse mehrerer Zeitrahmen
Viele Ichimoku-Händler analysieren mehrere Zeitrahmen:
- Höherer Zeitrahmen für die allgemeine Trendrichtung
- Mittlerer Zeitrahmen für Einstiegssignale
- Niedriger Zeitrahmen für präzises Einstiegs-Timing
3. Verbreiterung/Verengung der Senkou-Spans
- Verbreiternde Wolke: Zunehmende Marktvolatilität, stärkerer Trend
- Verengende Wolke: Abnehmende Volatilität, potenzielle Trendabschwächung
4. Flache Kumo (flache Wolke)
Wenn beide Senkou-Spans parallel verlaufen, deutet dies oft auf einen starken Trend mit klaren Unterstützungs-/Widerstandsebenen hin.
Praktische Anwendungen
Ideale Marktbedingungen
Die Ichimoku-Cloud funktioniert am besten in Trendmärkten und über alle Zeitrahmen hinweg. Sie kann angewendet werden auf:
- Forex
- Aktien
- Rohstoffe
- Kryptowährungen
- Indizes
Risikomanagement
- Verwenden Sie die Wolke als dynamisches Stop-Loss-Niveau
- Passen Sie die Positionsgröße basierend auf der Wolkendicke an (dickere Wolke = höhere Volatilität)
- Betrachten Sie Kijun-sen als Trailing Stop bei starken Trends
Kompatibilität der Zeitrahmen
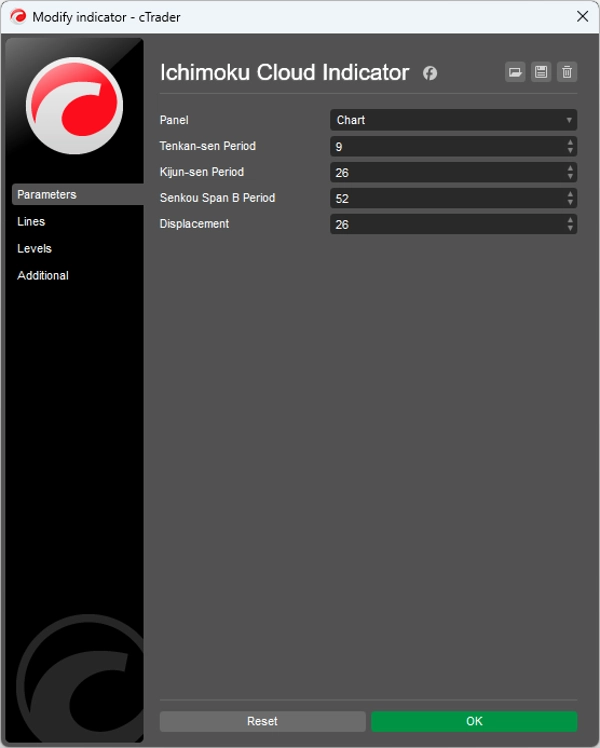
Die traditionellen Einstellungen (9, 26, 52) basierten auf der japanischen Handelswoche (die 6 Tage hatte), daher passen einige Händler diese Einstellungen an:
- 10, 30, 60 für Tagescharts
- 20, 60, 120 für konservativere Signale
- 7, 22, 44 für westliche Märkte (5-Tage-Handelswoche)
Fazit
Die Ichimoku-Cloud bietet ein umfassendes Handelssystem, das mehrere Ebenen von Marktinformationen in einer einzigen Ansicht bereitstellt. Was sie kraftvoll macht, sind nicht nur einzelne Signale, sondern das Zusammenwirken mehrerer Indikatoren. Wenn alle Komponenten übereinstimmen, kann das Ichimoku-System Handelsmöglichkeiten mit hoher Wahrscheinlichkeit und klar definierten Risikoparametern bieten.
Obwohl es zunächst komplex erscheint, können Händler mit Übung tatsächlich Marktbedingungen „auf einen Blick“ beurteilen, wie Hosoda es beabsichtigte. Die zeitverschobenen Komponenten des Systems bieten zudem eine einzigartige Perspektive auf die Marktdynamik, sodass Händler potenzielle zukünftige Unterstützungs- und Widerstandsniveaus sehen können, bevor sie relevant werden.
Zusammenfassung
1. Tenkan-sen (Conversion Line): short-term momentum indicator and dynamic support/resistance.
2. Kijun-sen (Base Line): medium-term momentum indicator and stronger support/resistance, also used as a trailing stop.
3. Senkou Span A (Leading Span A): forms the leading edge of the cloud (Kumo), projected 26 periods ahead.
4. Senkou Span B (Leading Span B): forms the trailing edge of the cloud, projected 26 periods ahead.
5. Chikou Span (Lagging Span): current closing price plotted 26 periods back, confirming trends and potential reversals.
The cloud (Kumo), formed between Senkou Span A and B, represents support and resistance zones, with thickness indicating volatility and strength. The indicator provides trend determination, entry and exit signals, and support/resistance levels. It is applicable across various markets including Forex, stocks, commodities, cryptocurrencies, and indices, and works best in trending markets and multiple time frames. Risk management features include dynamic stop-loss levels based on the cloud and position sizing adjustments according to cloud thickness. Traditional settings are (9, 26, 52) periods, with common adjustments for different trading weeks.


