
Penerangan
Penunjuk Kedai Pinescriptlabs: Kedai cBots Pinescriptlabs : (cBot) Gold & BTC BreakoutSession Pivots(baru)
Ramalan Berdasarkan Linreg & ATR
Sokongan SmartTrend &
Rintangan
Garis
Dinamik
Struktur Pasaran
Analisis
daripada
Titik
Pusingan
Fibonacci
Regresi
Linear
Berbilang jangka masa
Penjejak
Bias Lilin
Berbilang Tahap
Sokongan
dan Rintangan
Garis
Trend
Semua
Sokongan dan
Rintangan
Tahap
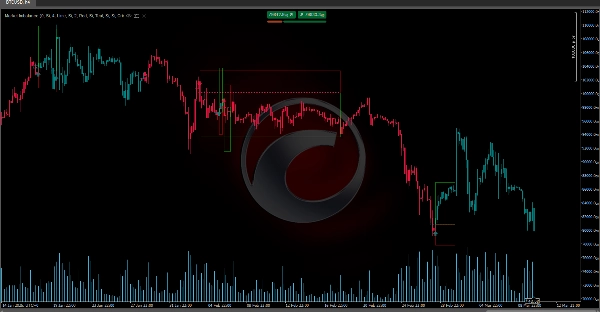
MarketImbalanceDetector mengenal pasti ketidakseimbangan pasaran dan menandakan kawasan utama secara visual berdasarkan corak harga dan volatiliti (ATR). Berikut adalah ringkasan mudah bagaimana ia berfungsi:
🔍 Pengesanan Isyarat
Ia membandingkan harga bar sebelumnya untuk mengesan corak bullish atau bearish. Menggunakan syarat tertentu (seperti membandingkan rendah dan tinggi bar sebelumnya) dan menapis isyarat dengan volatiliti semasa, ia memastikan pergerakan itu signifikan.
📊 Visualisasi Ketidakseimbangan
Apabila isyarat dikenal pasti, penunjuk melukis pada carta:
- Kawasan Ketidakseimbangan (segi empat tepat) menandakan zon di mana corak berlaku.
- Garis Tahap Purata (dikira dari tinggi dan rendah yang berkaitan) untuk membantu memvisualisasikan sokongan atau rintangan.
- Ikon (anak panah) menunjukkan arah isyarat (⬆️ untuk bullish, ⬇️ untuk bearish).
Zon OP/PE
Selain itu, ia mencipta zon yang dipanggil OP () dan PE (Titik Melarikan Diri). Zon-zon ini dikira dengan menambah atau menolak gandaan ATR kepada tahap purata, membantu menentukan kawasan untuk mengambil keuntungan atau memotong kerugian.
Ringkasan
When a signal is detected, the indicator visually marks the chart with:
- An Imbalance Area (a rectangle) highlighting the zone where the pattern occurred.
- An Average Level Line calculated from relevant highs and lows to indicate potential support or resistance.
- An Icon (arrow) showing the signal direction: upward for bullish and downward for bearish.
Additionally, the indicator calculates OP (Order Point) and PE (Escape Point) zones by adding or subtracting multiples of ATR to the average level. These zones assist traders in defining areas for taking profit or cutting losses.
This tool supports analysis across various markets including cryptocurrencies (e.g., BTCUSD), commodities (e.g., XAUUSD), and integrates concepts related to breakout strategies, trend indicators like Supertrend, and momentum measures such as RSI. It is intended to enhance market structure understanding and assist in decision-making by visually representing key imbalance zones on trading charts.


