
Penerangan
Klasik Proportional CVD (Berjangkar)
Buka niat sebenar peserta pasaran dengan Klasik Proportional CVD. Berbeza dengan penunjuk Cumulative Volume Delta standard yang hanya menjumlahkan jumlah tick, alat ini menggunakan Logik Proportional untuk menimbang jumlah berdasarkan tindakan harga sebenar dalam setiap bar.
Mengapa Delta "Proportional"?
CVD standard boleh mengelirukan. Penunjuk ini mengira delta dengan menganalisis hubungan antara Julat Bar (Tinggi-Rendah) dan jarak Tutup-Buka. Ini memastikan jumlah diedarkan secara realistik:
- Lilin keyakinan kuat (menutup berhampiran tinggi/rendah) menyumbang lebih kepada delta.
- Lilin berat sumbu (tanda penyerapan atau penolakan) meneutralkan delta, mengelakkan isyarat jumlah "palsu".
Ciri Utama
- ⚓ Penjangkaran Pintar (Reset Multi-Masa): Kekalkan analisis anda relevan dengan sesi dagangan semasa. Pilih untuk menetapkan semula pengiraan Harian, Mingguan, atau Bulanan—atau biarkan ia berjalan tanpa had.
- 📊 Visual Berganda:
-
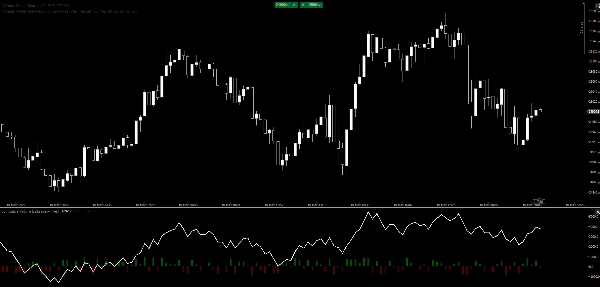
- Garis CVD: Garis bersih dan berprestasi tinggi untuk mengenal pasti perbezaan jangka panjang dan keletihan tren.
- Lapisan Histogram: Maklum balas visual segera pada tekanan beli/jual setiap bar untuk mengenal pasti klimaks atau penyerapan dengan cepat.
- ⚡ Sangat Ringan: Ditulis dengan pengoptimuman C# asli untuk cTrader, memastikan tiada kelewatan walaupun pada mesin berprestasi rendah atau pasaran yang tidak stabil.
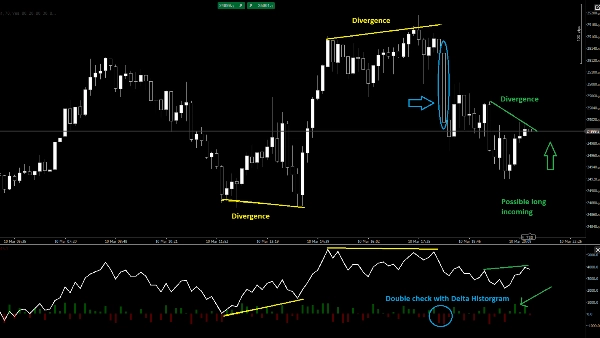
- 🎯 Pengenalpastian Perbezaan: Mudah mengenal pasti apabila harga membuat paras tinggi baru sementara CVD gagal—tanda klasik pengedaran institusi.
Cara Berdagang dengan ia
- Pengesahan Tren: Cari garis CVD yang bergerak dalam arah yang sama dengan harga.
- Penyerapan: Apabila harga mencapai paras rendah baru tetapi Histogram CVD menunjukkan "Delta Up" (Hijau) yang kuat, pembeli menyerap tekanan jualan.
- Keletihan: Perhatikan lonjakan tajam dalam histogram (Klimaks) diikuti oleh pembalikan garis CVD.
Parameter:
- Mod Penjangkaran: Tidak Pernah, Harian, Mingguan, Bulanan.
- Tunjukkan Delta Bar: Togol histogram hidup/mati.
Buka niat sebenar peserta pasaran dengan Klasik Proportional CVD. Berbeza dengan penunjuk Cumulative Volume Delta standard yang hanya menjumlahkan jumlah tick, alat ini menggunakan Logik Proportional untuk menimbang jumlah berdasarkan tindakan harga sebenar dalam setiap bar.
Mengapa Delta "Proportional"?
CVD standard boleh mengelirukan. Penunjuk ini mengira delta dengan menganalisis hubungan antara Julat Bar (Tinggi-Rendah) dan jarak Tutup-Buka. Ini memastikan jumlah diedarkan secara realistik:
- Lilin keyakinan kuat (menutup berhampiran tinggi/rendah) menyumbang lebih kepada delta.
- Lilin berat sumbu (tanda penyerapan atau penolakan) meneutralkan delta, mengelakkan isyarat jumlah "palsu".
Ciri Utama
- ⚓ Penjangkaran Pintar (Reset Multi-Masa): Kekalkan analisis anda relevan dengan sesi dagangan semasa. Pilih untuk menetapkan semula pengiraan Harian, Mingguan, atau Bulanan—atau biarkan ia berjalan tanpa had.
- 📊 Visual Berganda:
-
- Garis CVD: Garis bersih dan berprestasi tinggi untuk mengenal pasti perbezaan jangka panjang dan keletihan tren.
- Lapisan Histogram: Maklum balas visual segera pada tekanan beli/jual setiap bar untuk mengenal pasti klimaks atau penyerapan dengan cepat.
- ⚡ Sangat Ringan: Ditulis dengan pengoptimuman C# asli untuk cTrader, memastikan tiada kelewatan walaupun pada mesin berprestasi rendah atau pasaran yang tidak stabil.
- 🎯 Pengenalpastian Perbezaan: Mudah mengenal pasti apabila harga membuat paras tinggi baru sementara CVD gagal—tanda klasik pengedaran institusi.
Cara Berdagang dengan ia
- Pengesahan Tren: Cari garis CVD yang bergerak dalam arah yang sama dengan harga.
- Penyerapan: Apabila harga mencapai paras rendah baru tetapi Histogram CVD menunjukkan "Delta Up" (Hijau) yang kuat, pembeli menyerap tekanan jualan.
- Keletihan: Perhatikan lonjakan tajam dalam histogram (Klimaks) diikuti oleh pembalikan garis CVD.
Parameter:
- Mod Penjangkaran: Tidak Pernah, Harian, Mingguan, Bulanan.
- Tunjukkan Delta Bar: Togol histogram hidup/mati.
Ringkasan
Key features include smart anchoring with multi-timeframe resets (daily, weekly, monthly, or continuous), dual visuals comprising a CVD line for spotting divergences and trend exhaustion, and a histogram overlay for immediate per-bar buying or selling pressure insights. The indicator is optimized in native C# for cTrader, ensuring high performance and low resource use.
Traders can use the indicator for trend confirmation by aligning CVD direction with price, identify absorption when price lows coincide with strong positive delta in the histogram, and detect exhaustion through histogram spikes followed by CVD reversals. Adjustable parameters include anchor mode and histogram display toggle.
This tool supports analysis across multiple markets and symbols, including Forex, cryptocurrencies, indices, commodities, and stocks.
Ulasan pelanggan
5 | 0 % | |
4 | 100 % | |
3 | 0 % | |
2 | 0 % | |
1 | 0 % |


