
Penerangan
Dinamik Trend Lanjutan dengan Jalur Bollinger Oscillator
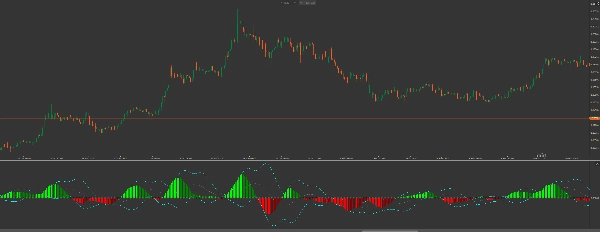
The Squeeze Pro: Momentum & Volatility Suite adalah satu set alat bertaraf institusi untuk cTrader. Berbeza dengan penunjuk standard, suite ini menyediakan analisis dua lapisan terhadap tingkah laku pasaran: ia mengenal pasti Fasa Squeeze (pemampatan pasaran) dan memantau Momentum Ekstrem menggunakan Jalur Bollinger yang dikira terus pada oscillator itu sendiri.
Inovasi Utama
-
- Jalur Bollinger Momentum: Yang pertama seumpamanya. Dengan menggunakan BB pada histogram momentum, anda boleh mengenal pasti tahap momentum "terbeli" atau "terjual berlebihan"—sesuai untuk masa keluar sebelum trend habis.
- Pengesanan Squeeze Tiga Keadaan:
-
- Titik Hitam (Squeeze On): Pemampatan tinggi. Pasaran sedang "menggulung" untuk pecahan besar.
- Titik Kelabu (Squeeze Off): Volatiliti sedang berkembang. Pergerakan telah bermula.
- Titik Biru (Tiada Squeeze): Keadaan pasaran normal.
- Pelicinan Regresi Linear: Menggunakan algoritma
CalculateLinearRegressionyang dipertingkatkan untuk menapis bunyi harga, memberikan histogram yang lancar dan boleh dipercayai. - Logik Lapisan Berganda: Beroperasi dalam tetingkap penunjuk berasingan untuk memastikan carta harga anda bersih sambil menyediakan pandangan analitik mendalam.
Panduan Kecerdasan Visual:
-
- Histogram (Trend & Kekuatan)
-
- Lime: Momentum menaik sedang mempercepat (Pembelian Kuat).
- Hijau: Momentum menaik sedang melambat (Mengambil Untung).
- Merah: Momentum menurun sedang mempercepat (Penjualan Kuat).
- Maroon: Momentum menurun sedang melambat (Penjual Penat).
- Jalur Oscillator (Garis "Cyan")
-
- Apabila bar histogram menolak keluar dari Jalur Bollinger Cyan, trend semasa berada pada tahap ekstrem statistik. Cari pembalikan atau penarikan balik besar apabila histogram mula mundur kembali ke dalam jalur ini.
Strategi Perdagangan: "Power Breakout"
-
- Kenal Pasti Squeeze: Tunggu Titik Hitam muncul pada garis sifar. Ini menunjukkan "ketenangan sebelum ribut."
- Sahkan Arah: Cari bar histogram pertama Lime (Beli) atau Merah (Jual).
- Pencetus: Masuk perdagangan apabila Squeeze Off (Titik Kelabu) muncul, menandakan pelepasan tenaga.
- Keluar: Ambil keuntungan apabila histogram berubah dari Lime ke Hijau, ATAU apabila histogram mencapai Jalur Atas Oscillator BB, menandakan keletihan.
Mengapa Naik Taraf ke Squeeze Pro?
Walaupun penunjuk asas menunjukkan ke mana harga pergi, Squeeze Pro menunjukkan tekanan di sebalik pergerakan itu. Dengan melihat squeeze dan jalur momentum secara serentak, anda mengelakkan memasuki trend yang sudah habis dan menangkap pergerakan meletup yang terlepas oleh orang lain.
Nota Pembangun: Penunjuk ini sangat dioptimumkan untuk API cTrader, memastikan tiada kelewatan prestasi walaupun pada mesin berprestasi rendah sambil mengendalikan pengiraan regresi linear yang kompleks secara masa nyata.
Ringkasan
Key features include linear regression smoothing to reduce price noise, a dual-overlay display that keeps the price chart uncluttered, and a color-coded histogram that visually represents bullish and bearish momentum strength and changes. When histogram bars move outside the oscillator’s Bollinger Bands (cyan lines), it signals statistically extreme momentum levels, useful for timing entries and exits.
The indicator supports a "Power Breakout" trading strategy: traders wait for squeeze signals, confirm momentum direction via histogram colors, enter trades on squeeze release, and exit when momentum shows signs of exhaustion. This suite provides institutional-grade insights into trend pressure and momentum dynamics, helping traders identify potential explosive moves and avoid exhausted trends.
Ulasan pelanggan
5 | 0 % | |
4 | 100 % | |
3 | 0 % | |
2 | 0 % | |
1 | 0 % |


