
Descripción
Domina la volatilidad del mercado sin saturar el gráfico
El Squeeze Momentum Candle Painter es un indicador sofisticado de volatilidad y momentum basado en la lógica clásica del TTM Squeeze. En lugar de llenar tu pantalla con osciladores, esta herramienta colorea inteligentemente tus barras de precio, permitiéndote identificar movimientos explosivos de alta probabilidad y cambios de tendencia mientras mantiene tu gráfico principal limpio y profesional.
Resumen
El mercado transita entre dos estados: Compresión (Squeeze) y Expansión (Volatilidad). Este indicador utiliza la relación entre las Bandas de Bollinger y los Canales de Keltner para identificar estas fases, combinado con un algoritmo de momentum de Regresión Lineal para determinar la dirección y fuerza de la tendencia.
Características clave
-
- Codificación de color intuitiva: Reconoce instantáneamente el momentum de la tendencia mediante 4 colores de vela distintos.
- Algoritmo TTM Squeeze: Cálculo incorporado de la compresión del precio y la pendiente del momentum.
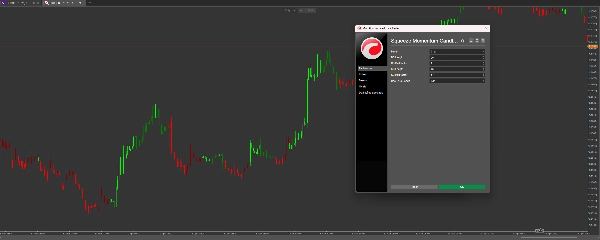
- Diseño de interfaz limpio: Elimina la necesidad de una ventana de histograma separada, dándote más espacio para el análisis de la acción del precio.
- Totalmente personalizable: Ajusta los parámetros de las Bandas de Bollinger y los Canales de Keltner para adaptarse a cualquier marco temporal o clase de activo (Forex, Índices o Cripto).
- Lógica sin retardo: Usa regresión lineal para detectar cambios de momentum más rápido que los promedios móviles tradicionales.
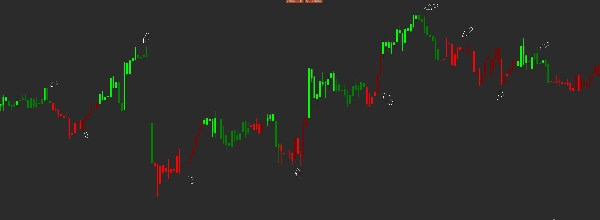
Cómo leer los colores :
-
- Lima » Fuerte momentum alcista (En aumento)
- Verde » Momentum alcista debilitándose (Disminuyendo)
- Rojo » Fuerte momentum bajista (En aumento)
- Granate » Momentum bajista debilitándose (Disminuyendo)
La estrategia de trading
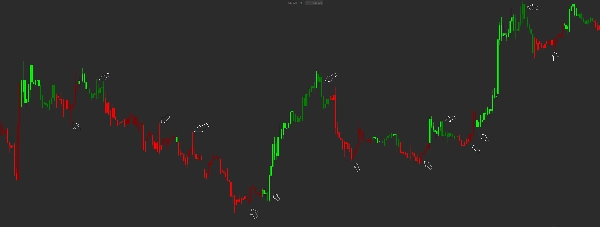
La acumulación: Cuando el momentum es bajo (Granate o Verde), el mercado suele estar "apretándose" o consolidándose.
La ruptura: Busca una transición de Verde a Lima (alcista) o de Granate a Rojo (bajista). Esto indica que el momentum se está acelerando.
La salida: Cuando una vela Lima se vuelve Verde, o una vela Roja se vuelve Granate, señala que el movimiento actual está perdiendo fuerza—un momento perfecto para tomar ganancias o ajustar los Stop Loss.
¿Por qué elegir este indicador?
La mayoría de los traders fallan porque reaccionan demasiado tarde. El Squeeze Momentum Candle Painter visualiza la energía "interna" del mercado. Al observar el cambio de colores de las velas, obtienes una ventaja psicológica, permaneciendo más tiempo en operaciones ganadoras y saliendo antes de que ocurra la reversión.
Resumen
Valoraciones de clientes
5 | 100 % | |
4 | 0 % | |
3 | 0 % | |
2 | 0 % | |
1 | 0 % |


