
説明
チャート分析を革新する
テクニカル分析の未来へ踏み出そう Delta-RSI Candle Pro – 普通のローソク足を強力なモメンタム可視化ツールに変える革新的なインジケーター。複数のインジケーターで画面を散らかす必要はありません。必要なものはすべてローソク足自体にあります。
オールインワンのビジュアルトレーディングソリューション
-
- 即時シグナル認識: 色で直感的に示されるモメンタムの強さと方向
- 画面スペースの最大化: 別のオシレーター画面を永久に排除
- 数学的精度: 高度な多項式回帰で真のRSIモメンタムを計算
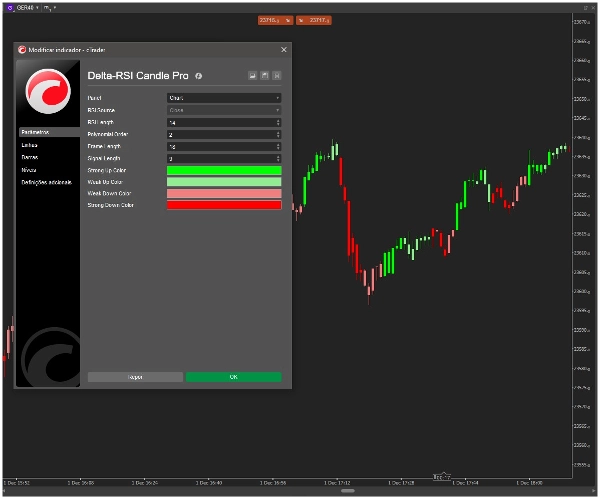
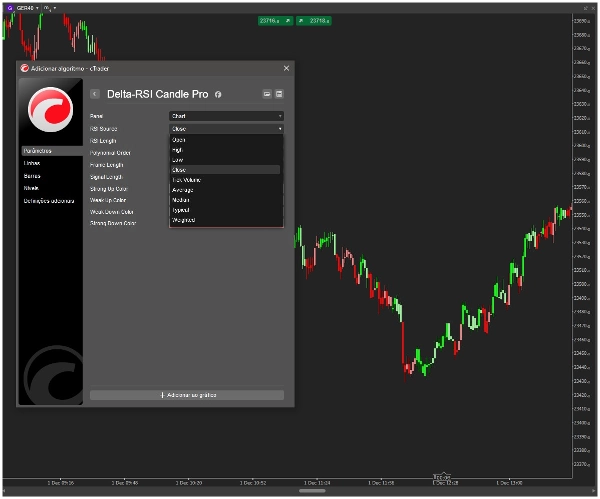
- 完全なカスタマイズ: cTraderのネイティブカラーピッカーでトレードスタイルに合わせて調整可能
- 信頼性と正確性: 確定価格データに基づく再描画なしの計算
Delta-RSI Candle Proの仕組み
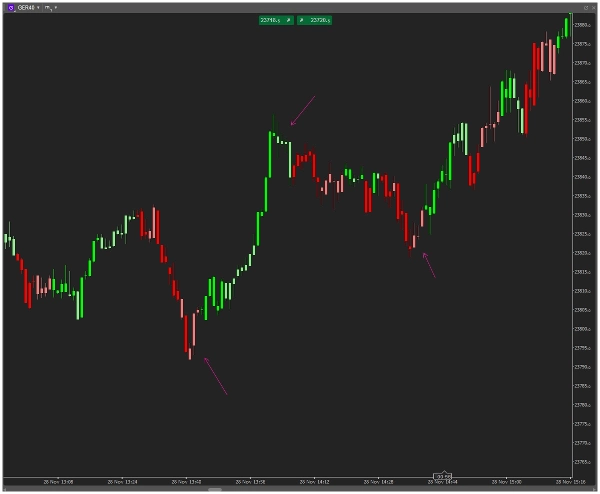
当社独自のアルゴリズムは RSIの瞬時の微分 を多項式曲線フィッティングで計算し、各ローソク足に知的な色を割り当てます:
-
- 強い強気: 鮮やかな緑 – ポジティブなモメンタムが加速中
- 穏やかな強気: 薄い緑 – ポジティブなモメンタムだが注意が必要
- 穏やかな弱気: 薄い赤 – ネガティブなモメンタムだが反転の可能性あり
- 強い弱気: 深い赤 – ネガティブなモメンタムが加速中
私たちを際立たせる主な特徴
-
- 🎯 直接ローソク足統合: 色がトレードローソク足に直接表示される
- 🎨 ビジュアルカラー選択: 直感的なcTraderカラーピッカー – コード名不要
- ⚙️ 完全調整可能: RSIの期間、多項式の次数、ルックバック期間を微調整可能
- 🚀 最適化されたパフォーマンス: スムーズな動作のための軽量計算エンジン
- 📊 プロフェッショナルグレードのアルゴリズム: 優れたシグナルのための数学的微分解析
誰に最適か?
-
- デイトレーダー 瞬時の視覚的モメンタムキューが必要な方
- スイングトレーダー トレンド変化を早期に識別したい方
- ミニマリストトレーダー チャートの散らかりを嫌う方
- アルゴリズムトレーダー 視覚的な確認を求める方
- すべての真剣なトレーダー 市場分析で優位性を求める方
数秒で始められます
-
- Delta-RSI Candle Proをチャートに追加
- ビジュアルピッカーで好みの色を選択
- トレード時間枠に合わせてパラメータを調整
- ローソク足にモメンタムパターンが即座に表示されるのを確認
技術的卓越性
-
- オーバーレイインジケータータイプ(別パネルなし)
- 再描画なしのアルゴリズム
- RSIの多項式微分計算
- すべてのシンボルと時間枠に対応
- 定期的なアップデートと改善
他のインジケーターが複雑さを増す中、Delta-RSI Candle Proは シンプルかつ強化しました。高度な数学的モメンタム分析を視覚的に直感的にしました。価格とインジケーターの間で注意を分散させる必要はもうありません。今やそれらは一体となって機能します。
革命的な新しい方法でチャートを見てみませんか?...
概要
AIによる概要
Delta-RSI Candle Pro is a technical indicator designed for integration directly onto trading candlesticks, transforming them into visual momentum indicators. It calculates the instantaneous derivative of the Relative Strength Index (RSI) using polynomial curve fitting to assess momentum strength and direction. The indicator colors each candle based on momentum: intense green for strong bullish acceleration, light green for mild bullish momentum, light red for mild bearish momentum, and deep red for strong bearish acceleration.
Key features include immediate visual signal recognition through candle coloring, elimination of separate oscillator panels to maximize chart space, and advanced mathematical precision with non-repainting calculations based on confirmed price data. Users can fully customize colors and parameters such as RSI length, polynomial order, and lookback period using cTrader’s native color pickers.
Delta-RSI Candle Pro is compatible with all symbols and timeframes and is optimized for smooth performance with a lightweight calculation engine. It is suitable for day traders, swing traders, minimalist traders, algorithmic traders, and others seeking clear, integrated momentum analysis without chart clutter. The indicator overlays directly on price candles, providing a cohesive system that combines price and momentum information visually.
インジケーターのプロフィール
カスタマーレビュー
5.0
レビュー: 1
5 | 100 % | |
4 | 0 % | |
3 | 0 % | |
2 | 0 % | |
1 | 0 % |
ディスカッション
よくあるご質問
Scalping
Supertrend
RSI
SMC
Grid
ATR
VWAP
cTrader Storeで入手可能な取引ボット、インジケーター、プラグインなどの商品は、第三者の開発者が提供するものであり、情報と技術の取得のみを目的としてご利用いただけます。cTrader Storeはブローカーではなく、投資助言や個人的な推奨を行うことも、将来のパフォーマンスを保証することもありません。
この作成者の他の商品


価格
登録日 14/02/2025
10
販売