
説明
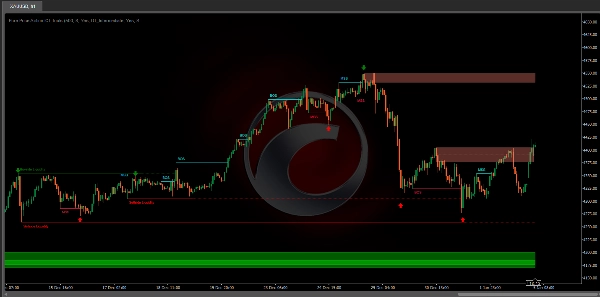
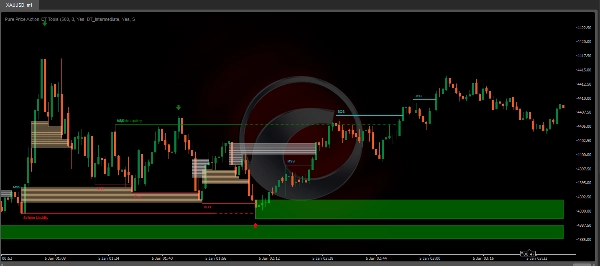
Pure Price Action ICT Toolsインジケーターは純粋なプライスアクション分析のために設計されており、リアルタイムの市場構造、流動性レベル、オーダー&ブレーカーブロック、および流動性の空白を自動的に識別します。
その独自の特徴は、ユーザー定義の入力に制約されることなく、価格パターンのみに依存していることで、市場の動態を堅牢かつ客観的に分析できる点にあります。
主な特徴
- 市場構造
市場構造のシフト(Change of Character、CHoCHとも呼ばれる)は、プライスアクション分析における重要なイベントで、市場のセンチメントや方向性の変化の可能性を示します。MSSは、価格が確立されたトレンドから反転するときに発生し、現在のトレンドの勢いが弱まっており、反転が進行中である可能性を示唆します。このシフトは、ダウントレンドにおけるより高い安値やアップトレンドにおけるより低い高値など、現在のトレンドの強さの弱まりを示す主要なテクニカルパターンによって特定されることが多いです。
構造のブレイク(Break of Structure、BOS)は通常、現在の市場トレンドの継続を示します。このイベントは、価格が以前のスイング高値または安値を決定的に超えるときに発生し、現在のトレンドの強さを確認します。アップトレンドでは、BOSは価格が以前の高値を突破することで示され、ダウントレンドでは価格が以前の安値を下回ることで識別されます。
市場構造のシフト(MSS)は潜在的なトレンド反転を示し、構造のブレイク(BOS)はトレンド継続を確認することが多いですが、完全な反転や継続を保証するものではありません。MSSおよびBOSレベルは、市場方向の変化を明確に示すのではなく、流動性ゾーンや価格の統合領域として機能することもあります。トレーダーはこれらのシグナルを慎重に扱い、取引判断を下す前に追加の要因で検証するべきです。ツールの他のコンポーネントの詳細については、以下のセクションを参照してください。
- オーダー&ブレーカーブロック
オーダーブロックとブレーカーブロックは、プライスアクション分析における重要な概念で、市場構造の重要なレベルをトレーダーが特定するのに役立ちます。
オーダーブロックは、重要な買いまたは売りの活動が発生した特定の価格ゾーンです。これらのゾーンは、大口の機関投資家やマーケットメイカーの行動を表すことが多く、市場に大きな影響を与える注文が実行されます。
ブレーカーブロックは、強い反転が発生し、現在の市場構造が破られる特定の価格ゾーンです。これらのブロックは、価格が重要な抵抗または支持に遭遇し、反転を引き起こした領域を示します。
まとめると、買い側および売り側の流動性は、市場の需要と供給の動態に関する重要な洞察を提供し、異なる価格レベルでの注文の利用可能性に基づいてトレーダーが情報に基づいた意思決定を行うのに役立ちます。
- 買い側&売り側流動性
買い側および売り側の流動性ゾーンは、市場の潜在的な転換点を特定するために重要です。これらのゾーンは、重要な買いまたは売りの関心が集中しており、将来の価格変動に影響を与えます。
まとめると、買い側および売り側の流動性は、市場の需要と供給の動態に関する重要な洞察を提供し、異なる価格レベルでの注文の利用可能性に基づいてトレーダーが情報に基づいた意思決定を行うのに役立ちます。
- 流動性の空白
流動性の空白は、取引活動がほとんどない価格チャート上のギャップや領域です。これらの空白は、買いまたは売りの注文がほとんどまたは全く存在しないゾーンを表し、市場がこれらの領域に入ると急激な価格変動を引き起こすことがよくあります。
まとめると、流動性の空白は取引活動が欠如している価格チャート上の重要な領域であり、急速な価格変動とボラティリティの増加をもたらす可能性があるため、トレーダーの分析と意思決定プロセスにおいて重要な考慮事項となります。
- スイングポイント
反転価格ポイントは一般にスイングポイントと呼ばれます。トレーダーは過去のスイングポイントを分析して市場のトレンドを把握し、潜在的な取引のエントリーおよびエグジットポイントを特定します。
このスクリプトでは、これらはバックペイントの対象となるため、検出された場所に実際には存在しないことに注意してください。
スイングポイントの検出とこのスクリプトの独自機能は、数値的なユーザー定義設定を必要とせず、プライスアクションのみに依存しています。プロセスは短期スイングポイントの検出から始まります:
- 短期スイング高値(STH):両側により低い高値がある価格のピークとして識別されます。
- 短期スイング安値(STL):両側により高い安値がある価格の谷として認識されます。
中期および長期のスイングポイントは同じ方法で検出されますが、わずかな修正があります。価格ローソク足を直接分析する代わりに、以前に検出された短期スイングポイントが使用されます。中期スイングポイントには短期スイングポイントが分析され、長期スイングポイントには中期スイングポイントが使用されます。
この方法は、市場の動態を堅牢かつ客観的に分析し、トレーダーに市場構造に関する信頼できる洞察を提供します。検出されたスイングポイントは、市場構造、買い側/売り側の流動性レベル、およびこのツールで提示されるオーダーおよびブレーカーブロックの識別の基礎となります。
まとめると、スイングポイントはテクニカル分析における重要な要素であり、トレーダーがトレンド、サポートおよびレジスタンスレベル、最適なエントリーおよびエグジットポイントを特定するのに役立ちます。スイングポイントを理解することで、トレーダーは市場の自然な価格変動に基づいて情報に基づいた意思決定を行うことができます。
設定
- 市場構造
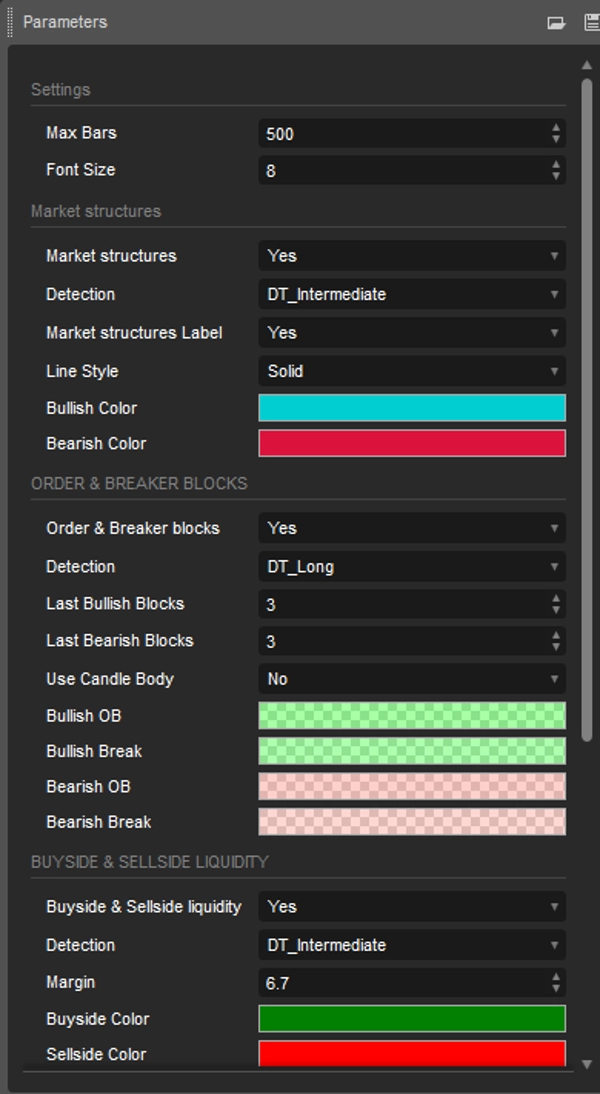
市場構造:市場構造のシフトおよびブレイクの表示を切り替えます。
検出:短期、中期、長期のスイングレベルの重要性に基づいて市場構造を検出するオプションです。
市場構造ラベル:市場構造の種類を強調表示するラベルの表示を制御します。
ラインスタイル:市場構造を表す線のスタイルをカスタマイズします。
- オーダー&ブレーカーブロック
オーダー&ブレーカーブロック:オーダー&ブレーカーブロックの表示を切り替えます。
検出:短期、中期、長期のスイングレベルの重要性に基づいてオーダー&ブレーカーブロックを検出するオプションです。
最新の強気ブロック:チャートに表示する最新の強気オーダー/ブレーカーブロックの数。
最新の弱気ブロック:チャートに表示する最新の弱気オーダー/ブレーカーブロックの数。
ローソク足の実体を使用:オーダーブロック領域としてローソク足の全範囲ではなく実体を使用することを許可します。
- 買い側&売り側流動性
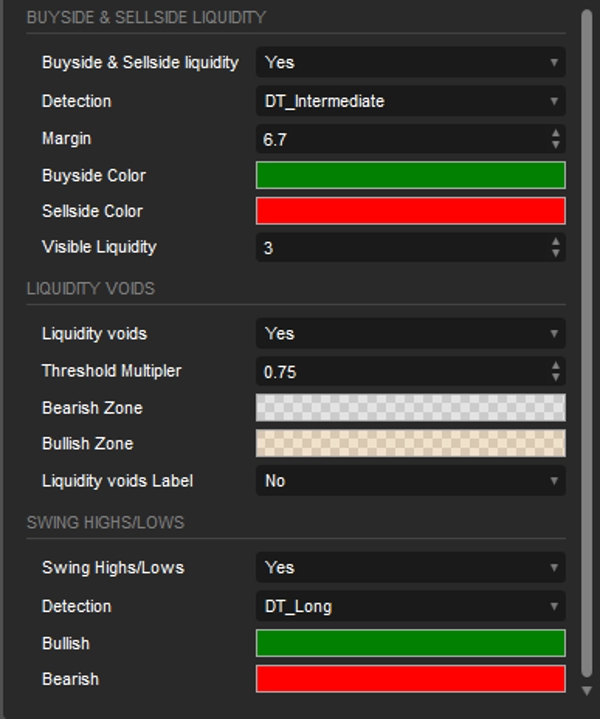
買い側&売り側流動性:買い側&売り側流動性レベルの表示を切り替えます。
検出:短期、中期、長期のスイングレベルの重要性に基づいて買い側&売り側流動性を検出するオプションです。
マージン:流動性レベル検出のためのマージン/感度を設定します。
表示流動性:表示する流動性レベル/ゾーンの量を制御します。
- 流動性の空白
流動性の空白:強気および弱気の流動性の空白の表示を有効にします。
閾値乗数:閾値の乗数を定義し、これは200期間のATR範囲にハードコードされています。
ラベル:流動性の空白を示すラベルの表示を有効にします。
- スイングポイント
スイング高値/安値:スイングレベルの表示を切り替えます。
検出:短期、中期、長期のスイングレベルの重要性に基づいてスイングレベルを検出するオプションです。
概要
Key functionalities include:
- Market Structures: Detects Market Structure Shifts (potential trend reversals) and Breaks of Structure (trend continuations) based on price patterns.
- Order & Breaker Blocks: Highlights significant price zones where institutional buying/selling or strong reversals occur.
- Buy-side & Sell-side Liquidity: Identifies zones of concentrated buying or selling interest that may influence price movements.
- Liquidity Voids: Marks price chart gaps with minimal trading activity, often leading to sharp price moves.
- Swing Points: Detects short-, intermediate-, and long-term reversal points to aid in trend analysis and trade decision-making.
The tool offers customizable settings to toggle visibility and detection sensitivity for each feature, including options to adjust detection based on swing level significance and display preferences. It supports analysis across various markets such as Forex, Crypto (e.g., BTCUSD), and indices (e.g., NAS100, XAUUSD). The indicator provides an objective framework for analyzing market dynamics based solely on price action patterns.
カスタマーレビュー
5 | 67 % | |
4 | 0 % | |
3 | 33 % | |
2 | 0 % | |
1 | 0 % |


