
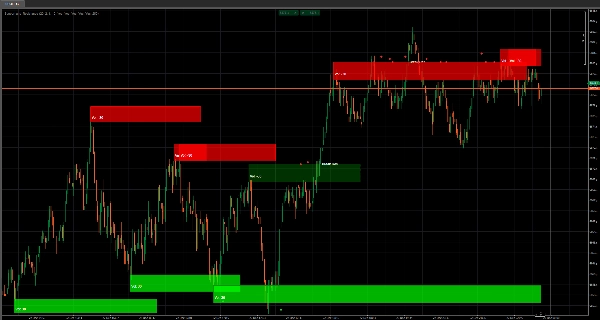
✅ Cajas de Soporte y Resistencia de Alto Volumen — mapea automáticamente las zonas reales de “defensa / ruptura”
✅ Fuerza de Zona Ponderada por Volumen (opacidad dinámica) — mayor volumen = mayor presencia de la caja
✅ Creación de Zona Basada en Pivotes (Lookback) — solo los niveles confirmados se convierten en zonas (menos ruido)
✅ Ancho Adaptativo de la Caja (basado en ATR) — las zonas se ajustan a la volatilidad actual, no a suposiciones fijas
✅ Extensión en Vivo de la Caja — las zonas siguen proyectándose hacia adelante a medida que evoluciona el precio
✅ Inteligencia de Ruptura / Sostenimiento — detecta cuándo una zona se sostiene o se rompe y reacciona al instante
✅ Marcas Visuales de Evento (Diamantes) — confirmaciones claras de “sostenimiento / cambio” sin complicaciones
✅ Etiquetas de Ruptura — eventos claros de “Ruptura de Soporte / Ruptura de Resistencia” en el gráfico
✅ Control Visual Completo — opciones para cajas / texto de volumen / diamantes / etiquetas de ruptura
✅ Sistema de Limpieza Automática — previene el desorden en el gráfico eliminando automáticamente marcas de eventos antiguas
✅ Control Máximo de Cajas — límite estricto para mantener el rendimiento rápido y los gráficos legibles
Soporte y Resistencia (Cajas de Alto Volumen) no es una herramienta básica de S/R que genera líneas aleatorias.
Este indicador está diseñado para mostrarte algo mucho más valioso:
Dónde el precio creó interés real — y dónde es más probable que reaccione nuevamente.
En lugar de dibujar “niveles bonitos,” construye zonas de oferta y demanda de alto volumen como cajas directamente en tu gráfico, para que puedas operar la estructura como un profesional:
identifica la zona → observa la reacción → opera el sostenimiento o la ruptura.
La Ventaja Principal: Volumen + Estructura, no suposiciones
Cada caja se crea solo cuando se alinean dos condiciones:
- Un pivote confirmado (la estructura importa)
- Un extremo de volumen (el interés importa)
Eso significa que no recibes spam con zonas débiles.
Obtienes menos zonas — pero las que obtienes son las que realmente importan.
Fuerza que Puedes Ver (Opacidad = Poder)
Aquí es donde se vuelve injusto para quienes operan con S/R “a ciegas.”
La opacidad del relleno de la caja se escala con el volumen, así que sabes al instante:
- Caja tenue = interés ligero (obsérvala)
- Caja fuerte = interés fuerte (respétala)
Sin indicadores adicionales, sin malabares interpretativos — es literalmente visible.
Zonas Adaptativas a la Volatilidad (Ancho ATR)
Los mercados no se mueven igual todos los días.
Este indicador adapta el grosor de la caja usando una línea base larga de ATR, por lo que las zonas se expanden o contraen con la volatilidad.
Resultado:
las zonas se mantienen realistas en lugar de ser demasiado delgadas para importar o tan anchas que son inútiles.
Inteligencia de Sostenimiento vs Ruptura (y Retroalimentación Visual Instantánea)
Una zona solo es valiosa si puedes leer lo que el precio está haciendo con ella.
Este indicador rastrea:
- Sostenimientos (rechazo / respeto)
- Rupturas (aceptación a través de la zona)
…y luego actualiza el estilo en vivo:
- Los sostenimientos mantienen la “identidad de soporte/resistencia” original
- Las rupturas invierten el comportamiento (el soporte puede convertirse en resistencia y viceversa)
- El estilo de ruptura puede cambiar a punteado + nuevo tono de color para que sepas al instante:
“Este nivel acaba de cambiar de carácter.”
Diamantes + Etiquetas de Ruptura: disparadores de decisión claros
Obtienes marcadores de eventos simples y con alta señal:
- Diamantes para resaltar eventos de sostenimiento/cambio
- Etiquetas de ruptura para que nunca pierdas el momento en que un nivel se rompe
Es la diferencia entre pensar que algo se rompió… y saber que se rompió.
Diseñado para el Trading Real: Control + Gráficos Limpios
Este indicador fue diseñado para mantenerse usable después de horas de trading:
- ¿Quieres solo zonas? Apaga diamantes/etiquetas.
- ¿Quieres señales puras? Apaga el texto de volumen.
- ¿Quieres rendimiento? Limita Máximo de Cajas.
- ¿Odias el desorden? Eventos de Limpieza Automática mantiene el gráfico nítido eliminando marcas antiguas automáticamente.
Te mantienes enfocado en la batalla actual — no ahogado en la historia.
Configuración Recomendada (Inicio Rápido)
✅ Periodo de Lookback: 20 (confirmación equilibrada)
✅ Longitud del Filtro de Volumen: 2 (responsivo)
✅ Multiplicador de Ancho de Caja: 1.0 (neutral)
✅ Mostrar Cajas: ON
✅ Diamantes + Etiquetas de Ruptura: ON (hasta que aprendas el comportamiento, luego refina)
✅ Eventos de Limpieza Automática: ON (manténlo limpio)
Lo que este indicador realmente te da
Un mapa visual de dónde el mercado mostró sus cartas — y una lectura en vivo sobre si el precio está respetando esa zona o destruyéndola.
Si operas rupturas, retrocesos, reversiones o re-tests:
esto se convierte en tu “superposición de campo de batalla.”


![Logotipo de "[Stellar Strategies] Inside Bar with Signals"](https://cdn.ctrader.com/image/webp/1d9e8bfa-3b2c-4440-bb37-5856902008a7_30683)


