
Beschreibung
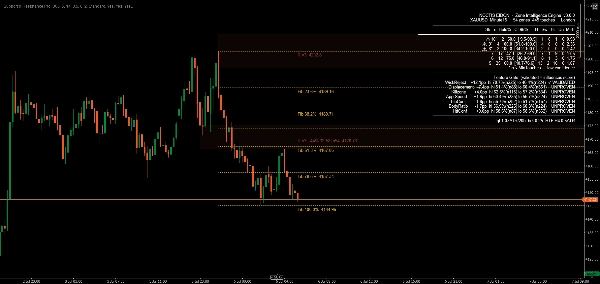
Support & Resistance Pro identifiziert Unterstützungs- und Widerstandsbereiche und — im Gegensatz zu den meisten S/R-Werkzeugen — misst, ob diese Bereiche tatsächlich funktionieren, mithilfe einer unabhängigen statistischen Engine, die auf realen historischen Daten basiert und nicht auf Annahmen. Jeder Bereich zeigt eine Haltbarkeitsrate mit einem Konfidenzintervall, berechnet aus der vollständigen historischen Zonendatenmenge, einschließlich der Bereiche, die später durchbrochen wurden und vom Chart verschwanden. Die meisten Indikatoren in dieser Kategorie zählen nur die heute noch sichtbaren Niveaus, was jede Stärkeangabe stillschweigend aufbläht. Dieser hier nicht.
Hauptmerkmale
- Statistisch validierte Zonen Jeder Bereich trägt eine echte, historisch gemessene Haltbarkeitsrate mit einem 95%-Konfidenzintervall — kein angenommener Stärke-Score. Ein Signal, Docht-Abweisung am Kontaktpunkt, wurde formal validiert: bestätigt auf EURUSD und Bitcoin, über mehrere Zeitrahmen hinweg, einschließlich eines echten Out-of-Sample-Tests, bei dem die Wirkung auf unbekannten Daten Stärke bewahrte.
- Automatischer Rollenwechsel Durchbrochene Unterstützung wird automatisch zu Widerstand und umgekehrt, mit einem deutlichen visuellen Marker — der Indikator verfolgt, auf welcher Seite des Preises sich eine Zone befindet und färbt sie entsprechend, anstatt die Farbe an der ursprünglichen Bildung der Zone zu fixieren.
- Höherer Zeitrahmen Kongruenz Zonen auf Ihrem Chart werden mit einem von Ihnen gewählten höheren Zeitrahmen abgeglichen, wobei die passende HTF-Struktur direkt als separate visuelle Überlagerung auf dem Chart dargestellt wird.
- Integration von Fibonacci-Retracements Automatische Fibonacci-Retracement-Level aus dem jüngsten Schwung, jeweils mit Verhältnis und exaktem Preis in der nativen Präzision Ihres Brokers beschriftet, automatisch von nahegelegenen Zonen entwirrt, sodass sich die Beschriftungen nie überlappen.
- Sättigungswarnung Zonen, die zu oft getestet wurden, werden markiert statt als stärker angenommen — unsere Daten zeigen, dass stark getestete Zonen tendenziell schlechter abschneiden, wahrscheinlich weil ihre ruhende Liquidität bereits aufgebraucht ist.
- Offenes Validierungstor Sechs zusätzliche Kandidatensignale — Körperverhältnis, Annäherungsgeschwindigkeit, Sitzungs-/Killzone-Timing und Verschiebungstests — werden live im integrierten Statistikpanel mit eigenen Haltbarkeitsraten angezeigt. Sie beeinflussen keine Bewertung oder Rangfolge, bis jedes unabhängig dieselbe Nachweisgrenze wie die Docht-Abweisung überschritten hat. Sie sehen genau, was bewiesen ist und was nicht.
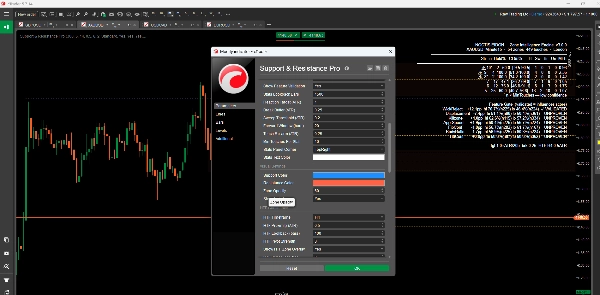
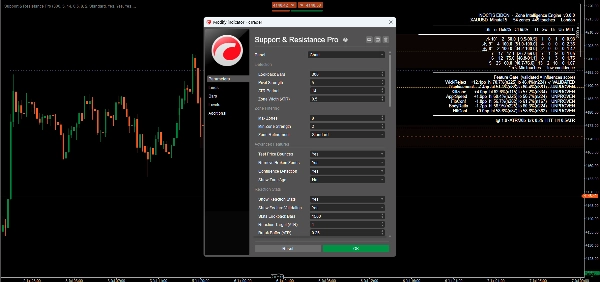
- Anpassbare Einstellungen Umfangreiche Parameterkontrolle über Erkennungsempfindlichkeit, Zonenausfilterung, visuelle Gestaltung und Alarmverhalten.
- Echtzeit-Benachrichtigungen Konfigurierbare Pop-up-, E-Mail- und Sound-Benachrichtigungen für Zonenkontakte, Ausbrüche und Kongruenzereignisse, unabhängig pro Kanal ein- und ausschaltbar.
Vorteile
- Beweise statt Annahmen: jede Statistik auf dem Chart kann unabhängig überprüft werden — der Indikator enthält eigene In-Sample/Out-of-Sample-Verifikationstools
- Kein Survivorship-Bias: Stärkeangaben basieren auf der vollständigen historischen Zonendatenmenge, nicht nur auf den Niveaus, die zufällig überlebt haben
- Ehrliche Offenlegung: bewiesene und unbewiesene Signale sind jederzeit als solche auf dem Chart gekennzeichnet
Ideal für
Trader, die die statistischen Belege hinter einem Niveau sehen wollen, nicht nur eine Linie — Daytrader, Swingtrader und systematische Trader im Forex-, Krypto- und anderen Instrumentenbereich, die einen rigoros gemessenen Ansatz für Unterstützung und Widerstand suchen.
Fazit
Support & Resistance Pro basiert auf einem Prinzip: Eine Stärkeangabe ist erst real, wenn sie gemessen wurde. Ein Signal hat diese Hürde mit instrumentenübergreifender, zeitrahmenübergreifender und Out-of-Sample-Bestätigung genommen. Der Rest wird ehrlich als noch in der Prüfung befindlich angezeigt — denn eine Zahl, die Sie nicht überprüfen können, ist es nicht wert, überhaupt gezeigt zu werden.
Zusammenfassung
- Dynamic support and resistance levels that adjust in real-time based on recent price action.
- Multi-timeframe analysis to view levels across different timeframes for a comprehensive market overview.
- Calculation and display of pivot points to mark potential intraday reversal zones and target prices.
- Highlighting of psychological price levels (round numbers) to gauge market sentiment.
- Integration of Fibonacci retracement levels to assist in identifying support and resistance during price corrections.
- Customizable settings for lookback periods, visualization styles, and color schemes to suit individual trading preferences.
- Clear graphical representation for easy identification of market conditions.
- Configurable real-time alerts when prices approach critical levels.
This indicator supports various trading styles including scalping, day trading, and swing trading, and is suitable for traders in forex, commodities, stocks, and indices markets. It is intended for both beginner and experienced traders seeking structured market analysis and enhanced decision-making through reliable support and resistance data.
Kundenbewertungen
5 | 100 % | |
4 | 0 % | |
3 | 0 % | |
2 | 0 % | |
1 | 0 % |


![„[Stellar Strategies] Market Session Ultimate“-Logo](https://cdn.ctrader.com/image/webp/61ffd537-0125-4246-9e72-42eca1791d64_28232)


