
Beschreibung
ZigzagSR – Dynamische Zigzag-Schwünge mit automatischer Unterstützung & Widerstand
Entdecken Sie eine klarere Marktstruktur und präzise Einstiegspunkte mit ZigzagSR, einem leistungsstarken cTrader-Indikator, der:
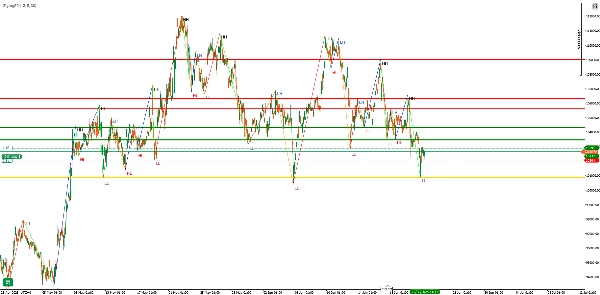
- Nicht-neuzeichnende Zigzag-Schwünge (höhere Hochs, niedrigere Hochs, höhere Tiefs, niedrigere Tiefs) in Echtzeit darstellt
- Automatisch dynamische Unterstützungs- & Widerstandsniveaus basierend auf den jüngsten Pivot-Schwüngen zeichnet
- Jeden Schwungpunkt („HH“, „LH“, „HL“, „LL“) für eine sofortige Trendübersicht beschriftet
Hauptmerkmale
- Adaptive Zigzag-Erkennung
-
- Konfigurierbare Tiefe, Abweichung und Rückschritt Parameter zur Feinabstimmung der Empfindlichkeit gegenüber Marktrauschen
- Nicht-neuzeichnende Logik stellt sicher, dass historische Signale stabil bleiben, sobald sie gezeichnet wurden
- Automatische SR-Niveaus
-
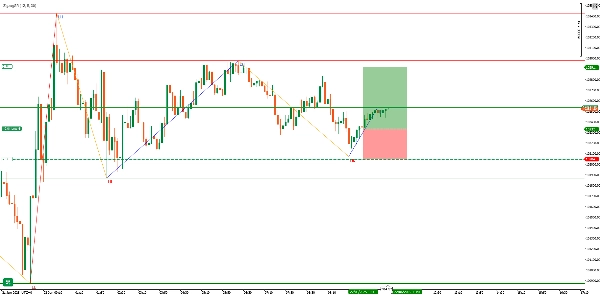
- Zeichnet eine Pivot-Linie am letzten gültigen Schwungpunkt (goldene Linie)
- Hebt bis zu den letzten drei Widerstandshochs (rote Linien) und drei Unterstützungstiefs (grüne Linien) vor dem Pivot hervor
- Linien aktualisieren sich nahtlos, wenn neue Schwünge entstehen, und halten Ihr Chart übersichtlich
- Klare visuelle Beschriftungen
-
- „HH“ (Higher High) und „LH“ (Lower High) für bärische/höhere Spitzen
- „HL“ (Higher Low) und „LL“ (Lower Low) für bullische/niedrigere Täler
- Farbkodierte Zigzag-Segmente:
-
- HH → Limette
- LH → Orange
- HL → Blau
- LL → Rot
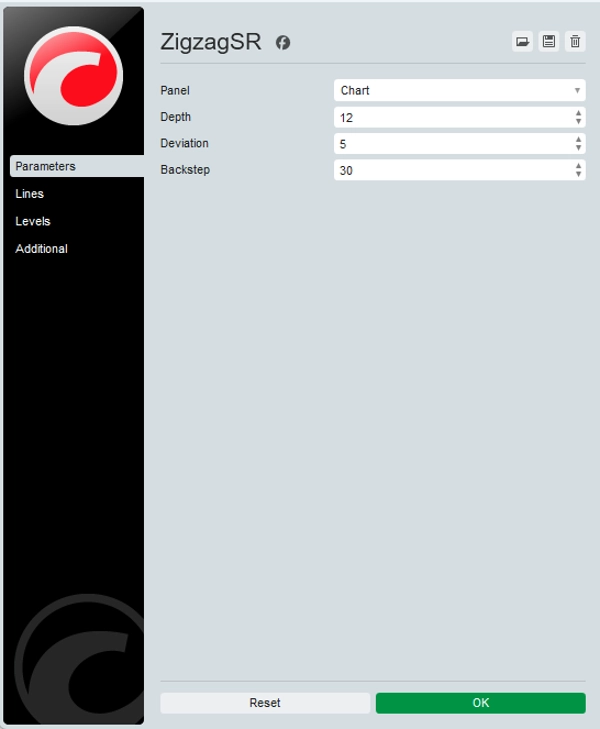
Eingaben & Anpassungen
ParameterStandardBeschreibung
Tiefe
12
Zurückblickende Balken zur Identifizierung lokaler Hochs/Tiefs
Abweichung
5
Minimale Kursbewegung (in Ticks), um als Schwung zu zählen
Rückschritt
3
Balken zum „Zurückspulen“ zur Unterdrückung falscher Pivots
Tipp: Erhöhen Sie Tiefe & Abweichung auf höheren Zeitrahmen, um Rauschen zu filtern; senken Sie sie auf M1/M5 für mehr Empfindlichkeit.
Warum ZigzagSR verwenden?
- Trendbestätigung: Unterscheiden Sie klar impulsive Schwünge von Korrekturbewegungen – ideal für Swing- und Breakout-Trader.
- SR-Einstiegszonen: Automatisch markierte Niveaus helfen Ihnen, Einstiegs-, Stop-Loss- und Take-Profit-Zonen ohne manuelles Zeichnen zu bestimmen.
- Strategieentwicklung: Beschriftungen und Linien fließen direkt in EAs/cBots oder manuelle Systeme ein – bauen Sie konsistente, regelbasierte Setups auf.
Funktionsweise
- Hoch-/Tief-Zuordnung
-
- Scannt Balken über die letzten
DepthPerioden, um lokale Extreme zu markieren (_highMap&_lowMap).
- Scannt Balken über die letzten
- Schwungkonstruktion
-
- Wechselt zwischen bullischen und bärischen Zuständen und fügt nur signifikante Pivots zur Schwungliste hinzu.
- Beschriftungszuweisung
-
- Vergleicht jeden Pivot mit dem vorherigen, um ihn als HH/LH oder HL/LL zu kennzeichnen.
- SR-Zeichnung
-
- Identifiziert den neuesten Pivot als „Pivot-Linie“ und zeichnet dann die vorherigen drei gültigen Hochs und Tiefs als Widerstand/Unterstützung.
- Zigzag-Darstellung
-
- Verbindet alle Schwungpunkte mit farbigen Trendlinien und legt Textbeschriftungen leicht versetzt für bessere Übersicht darüber.
Anwendungsfälle & Tipps
- Swing Trading: Nutzen Sie Mehrfachbalken-Impulse – steigen Sie bei Rücksetzern zur Pivot-Linie ein, zielen Sie auf das nächste SR-Niveau.
- Breakout-Bestätigung: Warten Sie, bis der Preis eine vom ZigzagSR gezogene Widerstandslinie durchbricht, und bestätigen Sie dann mit Volumen oder RSI.
- Überlagerung mit anderen Indikatoren: Kombinieren Sie mit gleitenden Durchschnitten, RSI-Divergenzen oder Volumenprofilen, um Signale zu verstärken.
Starten Sie in Sekunden:
- Installieren Sie ZigzagSR aus dem cTrader Store.
- Ziehen Sie es auf ein beliebiges Chart – keine externen Bibliotheken erforderlich.
- Passen Sie die drei Eingabeparameter an Ihren bevorzugten Zeitrahmen und Ihre Strategie an.
Verbessern Sie Ihre Chartanalyse mit Echtzeit-Schwungstruktur und dynamischer Unterstützung & Widerstand – probieren Sie ZigzagSR noch heute aus!
Zusammenfassung
Kundenbewertungen
5 | 33 % | |
4 | 67 % | |
3 | 0 % | |
2 | 0 % | |
1 | 0 % |


![„[Hamster-Coder] Bollinger Bands“-Logo](https://cdn.ctrader.com/image/webp/21d8e5d6-fb11-4bac-b9ee-cd05c2b76804_30327)


